
December 15, 2025, will remain etched in Bitcoin history as one of the year’s most brutal corrections. After reaching an all-time high of $126,000 in October, BTC plunged violently below $90,000 to touch $85,084, marking a major turning point in market dynamics. This comprehensive technical analysis dissects the mechanisms behind this drop and identifies key levels to monitor.
The Liquidation Cascade: A Vertical Drop
The bearish movement unfolded in a context of extremely low liquidity, typical of a crypto Sunday. Micro-structural analysis reveals a genuine cascade of liquidations, with over $200 million in leveraged positions liquidated in less than an hour.

On the 1-minute chart, the succession of very long-bodied red candles (bearish Marubozu) testifies to relentless selling pressure. The price successively broke through critical levels of $87,500 and $86,000, triggering massive stop-loss orders. Explosive transaction volumes confirm this was not rational selling, but forced liquidations by exchange risk engines.
Systematic Rejection at $90,000
Analysis of the 30-minute chart reveals a particularly concerning technical pattern. The psychological threshold of $90,000, which served as support since early December, flipped into major resistance.
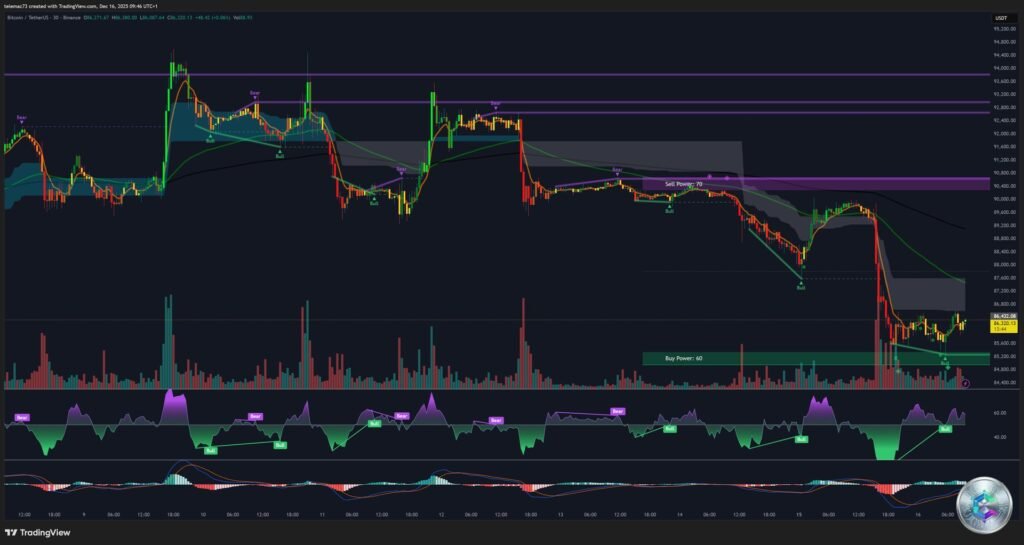
Each attempt to reconquer the $90,000 level was violently repelled, creating long upper wicks on the candlesticks. This behavior is symptomatic of institutional distribution or aggressive defense of short positions. Once this level was lost, trading algorithms massively switched to selling strategies, accelerating the drop.
Breaking the Parabolic Bullish Trend
On the daily chart, the technical structure reveals a major warning signal: the break of the parabolic bullish trend that supported the rise from $60,000. Even more concerning, a « Bear Flag » formation has developed.
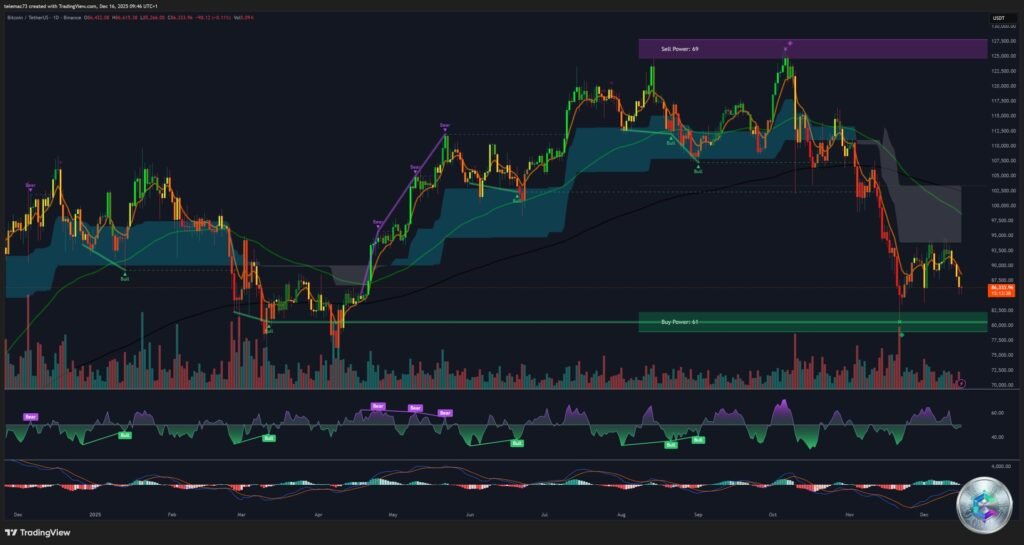
Chart theory indicates that a downward break of this bear flag could lead to a continuation of the bearish trend with a theoretical target toward the $70,000-$74,000 zone. The price now trades below its 50-day moving average, confirming that medium-term momentum has turned negative.
The Liquidation Heatmap: A Strategic Map
Analysis of the liquidation heatmap reveals a critical strategic configuration for the coming days. These liquidity zones act as magnets for price action.
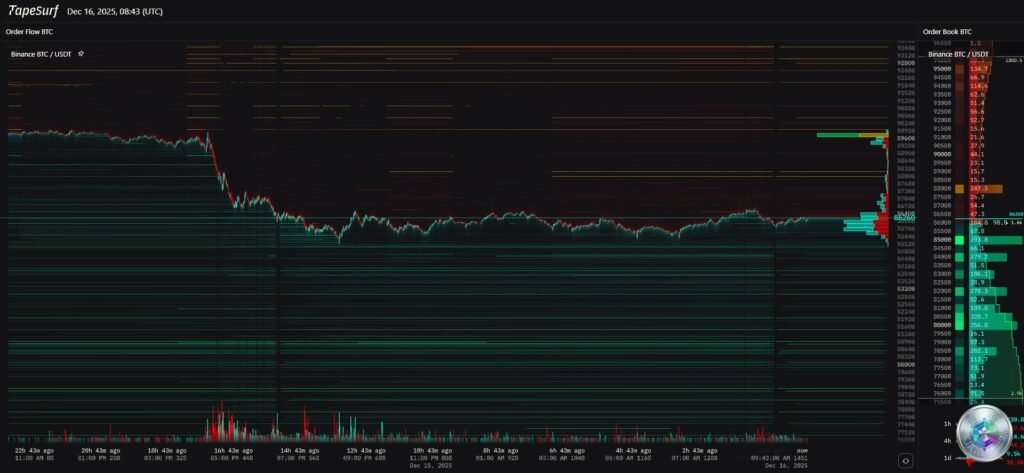
Upper liquidation zone (Short Squeeze): Between $90,000 and $92,000, a significant concentration of short positions could trigger an explosive bounce if this level is broken to the upside.
Lower liquidation zone (Long Liquidation): Around $83,000-$85,000, massive long positions remain vulnerable. If current support fails, the price will be « sucked » toward these levels to purge remaining leveraged buyers.
Macroeconomic Catalysts: The Japanese Threat
Beyond technical analysis, powerful macroeconomic factors explain this brutal correction. The Bank of Japan (BoJ) is preparing to raise its key rates by 25 basis points at its December 18-19 meeting, with a probability exceeding 90%.
This decision directly threatens the « Yen Carry Trade, » the mechanism where investors borrow Yen at near-zero cost to invest in risky assets like Bitcoin. Historically, each BoJ rate hike has coincided with 20-30% corrections in BTC. The December 15 drop is a rational anticipation of this global liquidity tightening.
Meanwhile, the Federal Reserve’s December rate cut was perceived as « hawkish » (defensive), reflecting concerns about economic growth rather than being a true stimulus. This ambiguity deprived Bitcoin of expected support.
Key Technical Levels to Watch
| Level (USD) | Type | Significance |
|---|---|---|
| 96,000 | Major Resistance | Invalidation of bearish thesis if broken |
| 90,000 – 92,000 | Critical Pivot Zone | Former support turned resistance, Short Squeeze zone |
| 86,700 | Current Price | Precarious equilibrium awaiting direction |
| 85,000 – 85,500 | Immediate Support | Crash low, buyers’ defense line |
| 83,000 – 84,000 | Major Support | Strong technical zone (Fibonacci 0.382) |
| 80,000 | Structural Support | Critical psychological line |
| 70,000 – 74,000 | Bearish Target | Bear Flag objective if continuation |
Prospective Scenarios for Late December
Scenario 1 – The Macroeconomic Purge (45%): If the BoJ adopts an aggressive tone on December 19, the $85,000 support could break, leading to a drop toward $70,000-$74,000. This capitulation would offer a « generational » buying opportunity for long-term investors.
Scenario 2 – The Bear Trap (35%): If $85,000 holds and the Japanese rate hike is already « priced in, » a gradual bounce toward $88,000-$95,000 is conceivable, with sideways consolidation until year-end.
Scenario 3 – The V-Shaped Recovery (20%): An unexpected external catalyst could trigger massive short position liquidations (Short Squeeze), propelling the price toward $96,000 and beyond. This scenario remains least likely given current headwinds.
Conclusion: A Necessary Maturity Correction
The December 15 crash marks a fundamental regime change for Bitcoin. The market has shifted from an unconditional « Buy the Dip » mode to a prudent regime where capital preservation comes first. On-Chain indicators, notably the STH-SOPR plunging below 1.0, suggest panic is already well established among short-term holders.
For professional traders, monitoring the $85,000 level (critical support) and $90,000 (pivot resistance) is paramount. Leverage use is strongly discouraged in this high-volatility environment. For long-term investors, a potential descent toward the $70,000-$80,000 zone should be considered a major strategic accumulation area.
This correction, though painful, is necessary to purge speculative excesses and build a more solid foundation for 2026. Bitcoin is undergoing a stress test of its institutional maturity, and its ability to bounce from this zone will determine the trajectory of the next bullish cycle.