
In early June 2026, Bitcoin (BTC) is navigating a structural dislocation of rare intensity. Global crypto market capitalization has contracted to $2.18 trillion — a cumulative drawdown of nearly 48% from the all-time high of $4.2 trillion — while BTC shed approximately 17% of its value in a single week, sliding from the $77,000 zone to test the critical psychological threshold of $60,000–$61,000. This report presents a rigorous, multi-dimensional dissection of this historic correction.
1. The Three Systemic Forces Behind the Collapse
This correction is not the result of an isolated shock. It embodies the destructive convergence of three major forces:
- Macroeconomic deterioration: ultra-restrictive US monetary policy and inflationary geopolitical tensions.
- Reversal of institutional ETF flows: exhaustion of the marginal demand that had fueled the bull market.
- MicroStrategy’s psychological rupture: the company’s first strategic Bitcoin sale since 2022, shattering the fundamental HODL narrative.
2. Macroeconomic Architecture: A Hostile Headwind
2.1. US Labor Market Resilience and Monetary Rigidity
The initial bearish catalyst stems from May 2026 Nonfarm Payrolls (NFP) data: the US economy generated 172,000 new jobs, significantly surpassing analyst consensus. This robustness obliterates hopes of an imminent Federal Reserve rate cut, entrenching the Higher for Longer doctrine. The logic is mathematically brutal: when 10-year Treasury yields offer elevated real returns, rational capital abandons volatile assets with no intrinsic cash flows like Bitcoin. The DXY index strengthens mechanically, exerting an inversely correlated downward pressure on BTC/USD.
2.2. Geopolitical Instability and the Oil Shock
The escalation of the US-Iran conflict acted as an asymmetric risk multiplier. Rising crude oil prices cement structural cost-push inflation that largely escapes traditional monetary tools. This conjuncture creates a double penalty for crypto markets: a generalized flight to dollar liquidity and a drying-up of global macroeconomic liquidity (M2), preventing the formation of new speculative flows.
| Macroeconomic Indicator | Current State (June 2026) | Impact on Bitcoin |
|---|---|---|
| NFP (Job Creations) | 172,000 (above consensus) | USD strengthening, annihilation of rate-cut expectations |
| Fed Funds Rate | Prolonged tightening | Higher opportunity cost, lower risk appetite |
| Oil Prices | Rising (Iran tensions) | Persistent structural inflation, implicit monetary tightening |
| BTC/Equities Correlations | Partial decoupling | BTC demoted to pure high-beta speculative asset |
3. The Bitcoin Spot ETF Hemorrhage and the Rotation Toward AI
3.1. The Historic Capital Exodus
The flow data are unequivocal. In early June 2026, US Bitcoin spot ETFs recorded historic net outflows of $3.4 billion in a single week, ending six consecutive weeks of positive net inflows. Over 12 consecutive trading days, cumulative net outflows approached $4 billion. May 2026, with over $2.43 billion in outflows, has been called the worst month of the year in terms of flows.
This dynamic reveals the absolute exhaustion of marginal demand: pioneering institutional investors are aggressively taking profits while the new potential cohort of buyers refuses to allocate capital amid the volatility. This abyssal asymmetry between abundant supply and near-nonexistent demand shatters the theoretical premise of a permanent ETF-driven liquidity floor.
3.2. The Sectoral Rotation Toward Artificial Intelligence
Liquidity extracted from the crypto market is not passively returning to safe havens. It is being actively and aggressively reallocated toward the sprawling artificial intelligence ecosystem: AI infrastructure providers, high-performance data center builders, GPU manufacturers, and emblematic tech companies like SpaceX and Alphabet. Bitcoin is being brutally demoted from « momentum investment » to « contrarian bet, » requiring radically different investor psychology and extreme patience in the face of prolonged drawdowns.
4. The MicroStrategy Paradigm: Fracturing the HODL Narrative
The deepest endogenous shock of this cycle originates from MicroStrategy (MSTR). Between May 26 and 31, 2026, the company executed the sale of 32 Bitcoins, generating approximately $2.5 million at an average price of $77,135 per unit. Quantitatively, this transaction is statistically insignificant — it represents 0.0038% of the 843,738 BTC treasury. Yet its psychological implications triggered systemic panic across the entire asset class.
| MicroStrategy Treasury Profile | Data (June 2026) |
|---|---|
| Total Bitcoin Holdings | ~843,738 BTC |
| Weighted Average Cost Basis | ~$75,700 |
| Sale Volume (Late May 2026) | 32 BTC (0.0038% of reserves) |
| Average Execution Price | $77,135 |
| Estimated Unrealized Losses (at $60-61k) | ~$10.8 billion |
| Reason for Sale | Preferred share dividends (11.5% annualized) |
The underlying reason: funding dividends on perpetual preferred shares at 11.5% annualized. By treating Bitcoin not as an untouchable store of value but as a fungible treasury asset, MicroStrategy irrefutably demonstrated that its treasury is not beyond the reach of secondary markets. This rhetorical fracture triggered a dreaded negative feedback loop: spot price declines correlate with MSTR stock drops, amplifying pressure on leveraged derivatives, worsening sentiment, and triggering further forced Bitcoin sales into an already illiquid order book.
5. Multi-Dimensional Technical Analysis
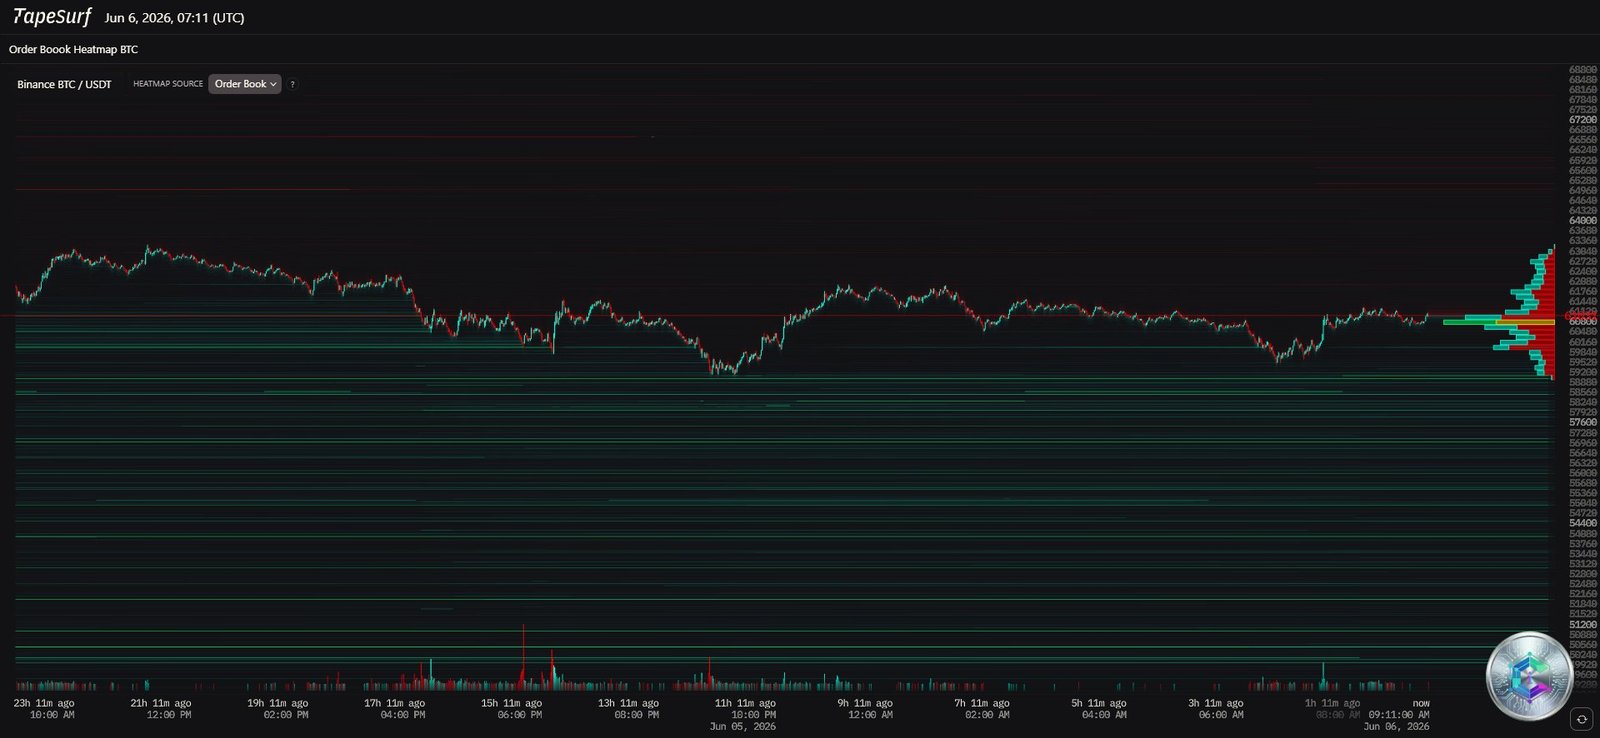
5.1. Order Book Heatmap — Liquidity Topography
The TapeSurf heatmap (Binance BTC/USDT) reveals critical liquidity stratification. A massive High Volume Node (HVN) is concentrated around $61,000–$61,200, acting as a gravitational center for price. Above the current level, imposing limit sell order walls are visible around $63,000 and beyond. The asymmetry is dangerous: the order book is relatively thin on the demand side (Bid side), meaning sellers can push price downward with far less friction than buyers would need to push through stacked sell-side liquidity layers.
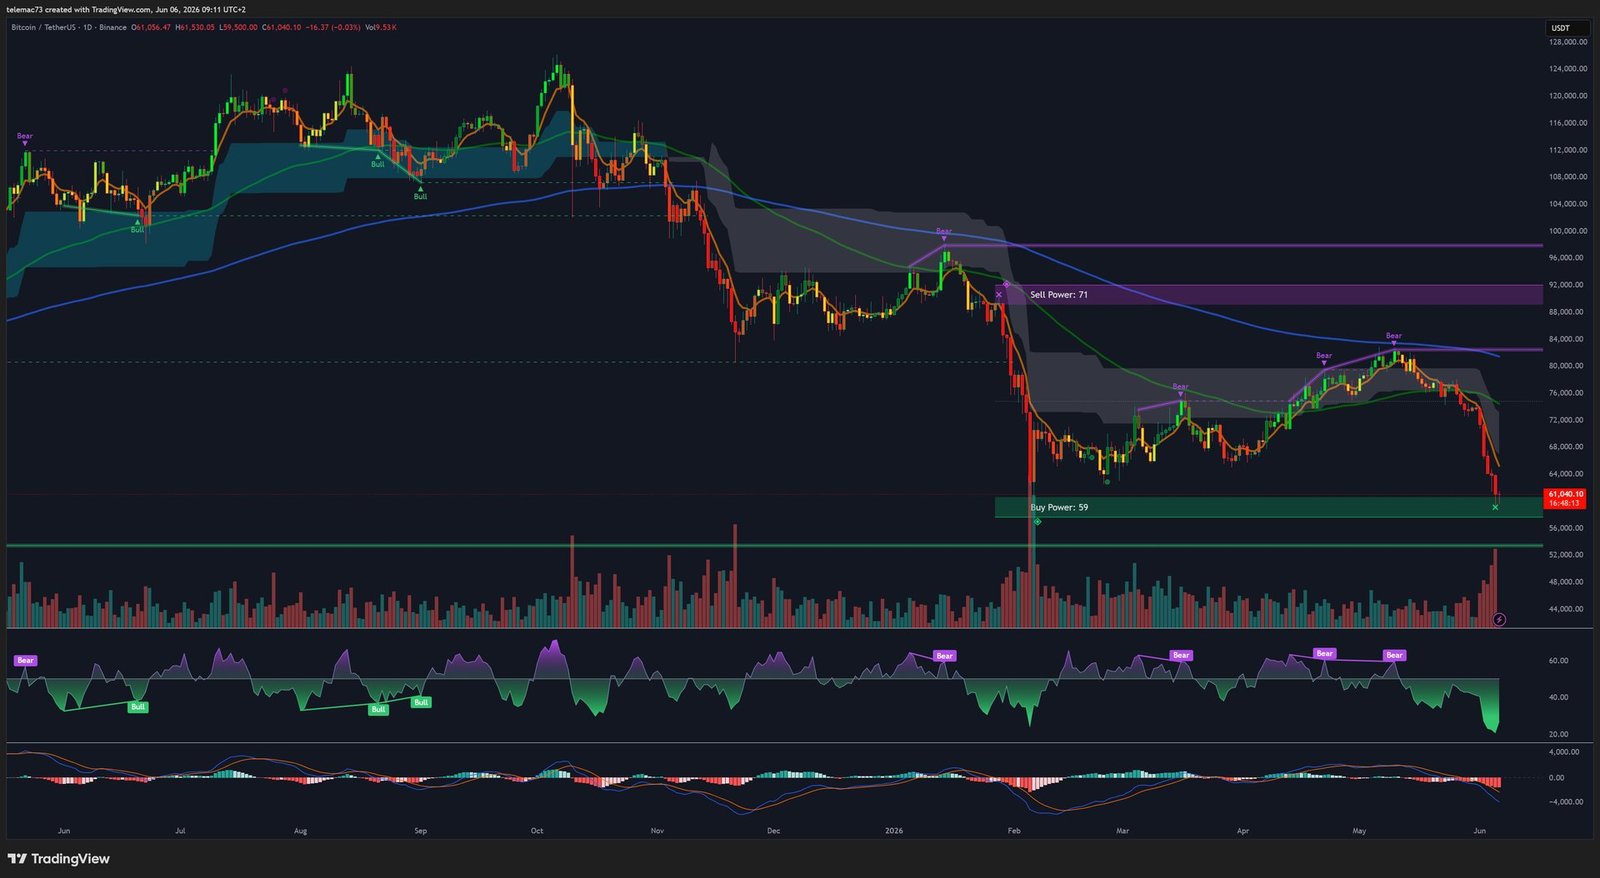
5.2. Daily Chart (Macro View) — Death Cross and Structural Damage
On the macroscopic daily timeframe, the chart architecture testifies to a total invalidation of the bullish market. The most devastating technical event is the materialization of a Death Cross: the EMA-50 has violently crossed below the EMA-200, signaling mathematically that short-term downward velocity has completely crushed the gravitational force of the long-term secular trend. Price is trading below the moving average resistance confluence: EMA-50 (~$75,216), EMA-100 (~$76,038), and EMA-200 (~$80,671–$82,130).
The flow power indicator displays an explicit imbalance: Sell Power: 71 vs Buy Power: 59. Key resistance levels sit at $62,500 (first resistance), $66,970 (critical confluence), then $71,354 (former broken ascending trendline, now acting as resistance via polarity). Below, a definitive break of $60,000 would open a liquidity vacuum toward the $50,000 Fair Value Gap.
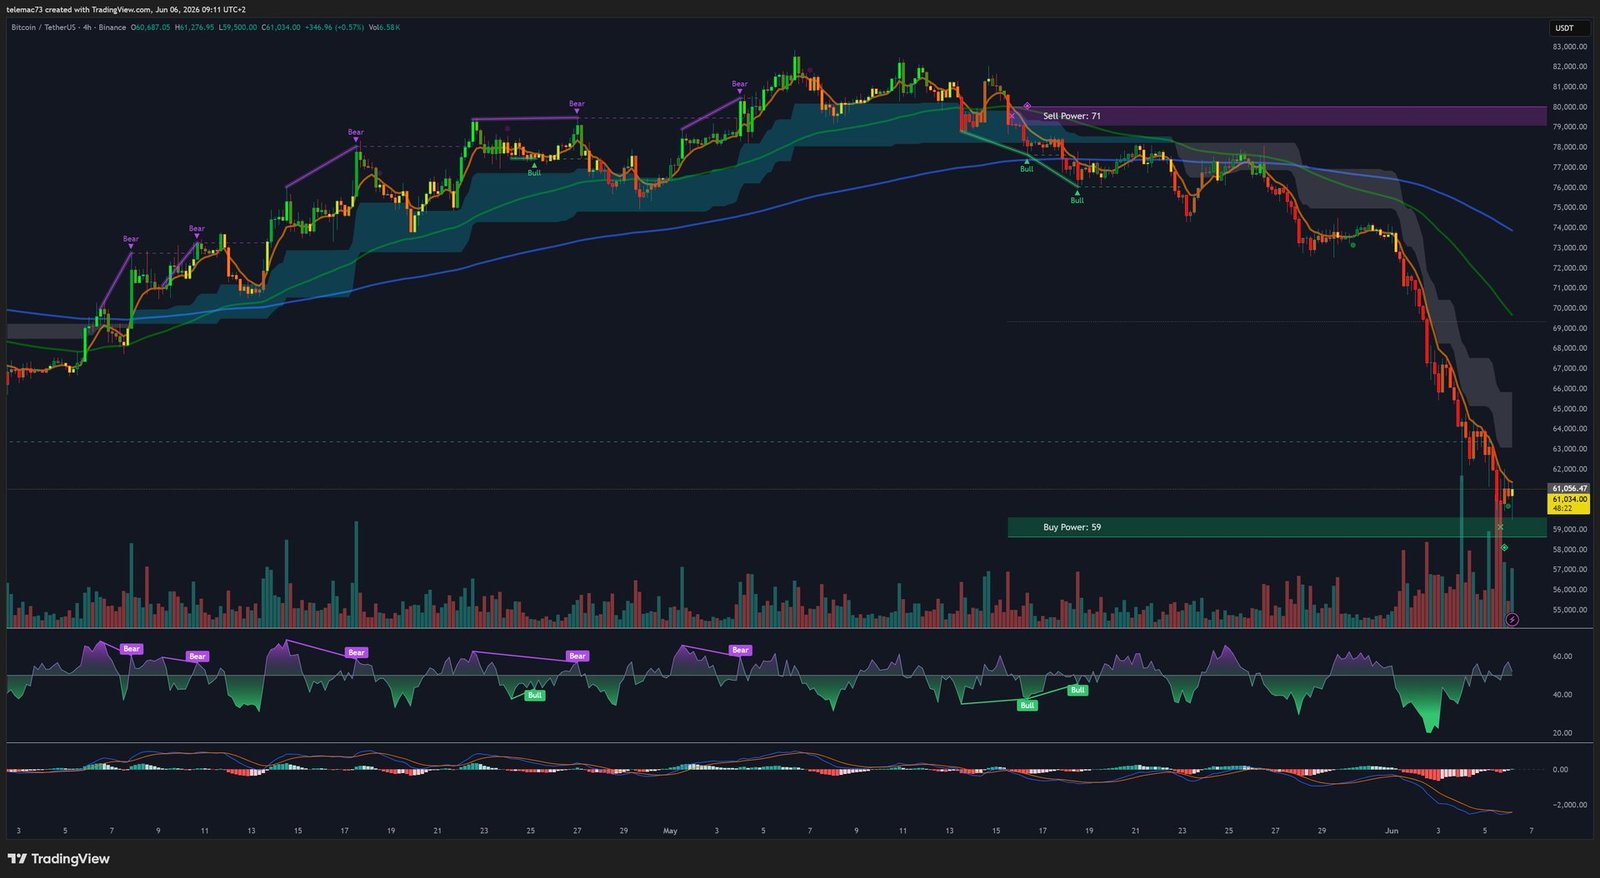
5.3. 4-Hour Chart — Bear Flags and Degraded Market Structure
The 4-hour chart provides a visceral view of the collapse mechanics. Market structure displays a relentless succession of Lower Highs and Lower Lows. Iterative Bear Flag formations repeat: after each vertical bearish impulse, price attempts an anemic, low-volume consolidation, before violently breaking below and triggering new liquidation cascades. Price action suffered a particularly violent rejection on the major descending trendline encapsulating distribution between $82,700 and $84,100.
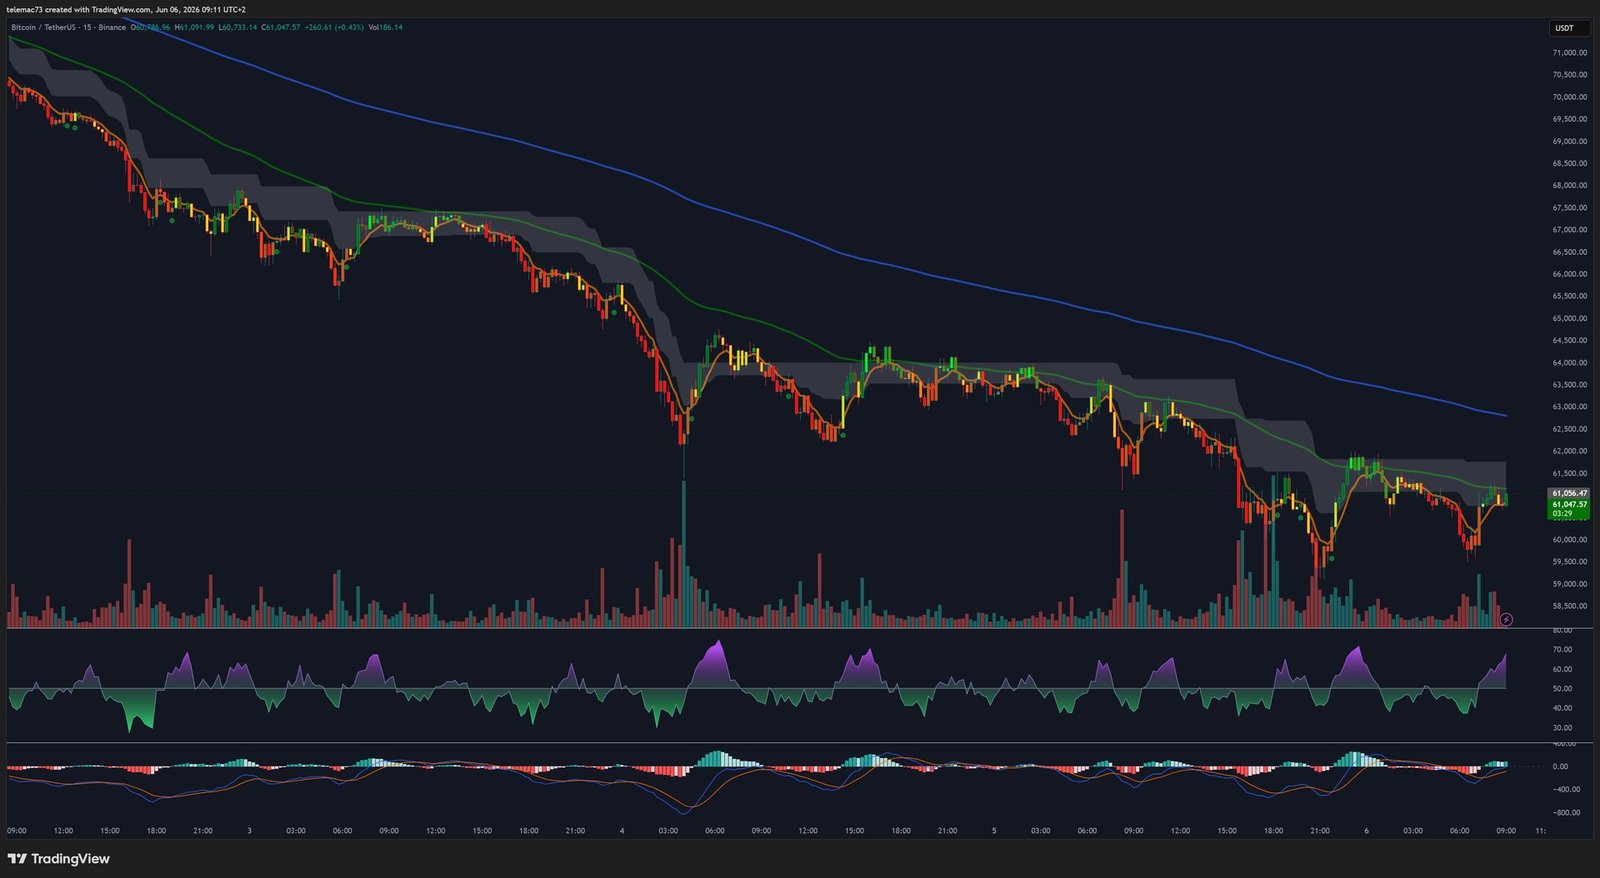
5.4. 15-Minute Chart — Algorithmic Liquidations and Short-Term Signals
On the intraday micro-structure (15M), around $61,047, the chart displays massive red volume spikes characteristic of panic capitulations (selling climaxes). The combined announcement of NFP data and the MicroStrategy transaction acted as a trigger for chain algorithmic executions. Between $1.2 and $1.86 billion in long derivatives positions were vaporized within days — a record for speculative capital destruction in 2026. On Binance alone, $532 million in longs were forcibly liquidated.
Nevertheless, the 15M MACD presents histograms shifting from deep red to light green — a very short-term Golden Cross suggesting local exhaustion of selling pressure. On higher timeframes (4H, Daily), the RSI has collapsed to a pathological level of 22.7, deeply below the oversold threshold (30). Historically, a daily RSI at these levels precipitates short squeezes of several thousand dollars, but in a macro-bearish regime, an oversold asset can remain oversold for weeks.
6. Quantitative Modeling: Monte Carlo Simulations
Quantitative firms like AIX Alpha have deployed AI engines to run more than 10,000 Monte Carlo simulations of Bitcoin’s behavior throughout June 2026. The aggregation of over 100,000 daily quantitative signals yields a counter-intuitive conclusion: the highest-probability scenario is not an immediate collapse toward $50,000, but a laborious stabilization around $60,000–$62,000. This hypothesis is supported by the deceleration of ETF outflows — daily redemptions fell to approximately $44 million in recent sessions, versus billions earlier in the month — a sign of terminal panic absorption within the HVN identified on the heatmap.
7. Strategic Synthesis and Conclusions
Bitcoin’s plunge toward $61,000 transcends a simple technical correction. It represents a structural, psychological, and institutional inflection point. Three conclusions emerge:
- Destruction of the fundamental narrative: The confluence of a hawkish Fed, the oil shock, and MicroStrategy’s reversal has methodically dismantled the thesis of Bitcoin as a decorrelated safe-haven asset. The asset undergoes a painful re-rating, relegated to a pure high-beta speculative vehicle.
- Deeply compromised technical configuration: The Death Cross, overhanging moving average resistances (up to $82,130), trapped supply zones between $66,900 and $71,300, and the liquidity void below $60,000 paint a fundamentally bearish picture for the near-to-medium term.
- Structural capital migration: The drying-up of ETF flows in favor of AI and aerospace represents a formidable competitive challenge. Without a formal Fed pivot or a major narrative catalyst, any durable recovery remains statistically marginal.
The current environment categorically precludes speculative leverage expansion. It dictates a return to capital preservation, strict monitoring of microstructure levels, and patient waiting for confirmed bullish RSI divergences at the extreme reading of 22.7. Bitcoin is entering a necessary expiation phase: the purge of accumulated leverage excesses is the indispensable precondition for the genesis of a new healthy institutional accumulation cycle.
⚠️ Important Disclaimer: This article is written exclusively for educational and informational purposes. It does not constitute investment advice, a recommendation to buy or sell, or an inducement to invest in digital assets or any other financial instrument. Cryptocurrency markets are extremely volatile and carry significant risk of capital loss. Any investment decision should be made after consulting a qualified financial advisor and in accordance with your personal situation and risk tolerance.