


On June 2, 2026, the cryptocurrency market — and specifically the BTC/USDT pair — stands at a pivotal technical crossroads. Following a historic macroeconomic correction from an all-time high of $124,000, Bitcoin is now testing the critical psychological and technical threshold of $70,000. Whether this level holds or breaks will determine the direction of the market for the weeks to come.
1. Macro Context: The Daily (1D) Timeframe Structure
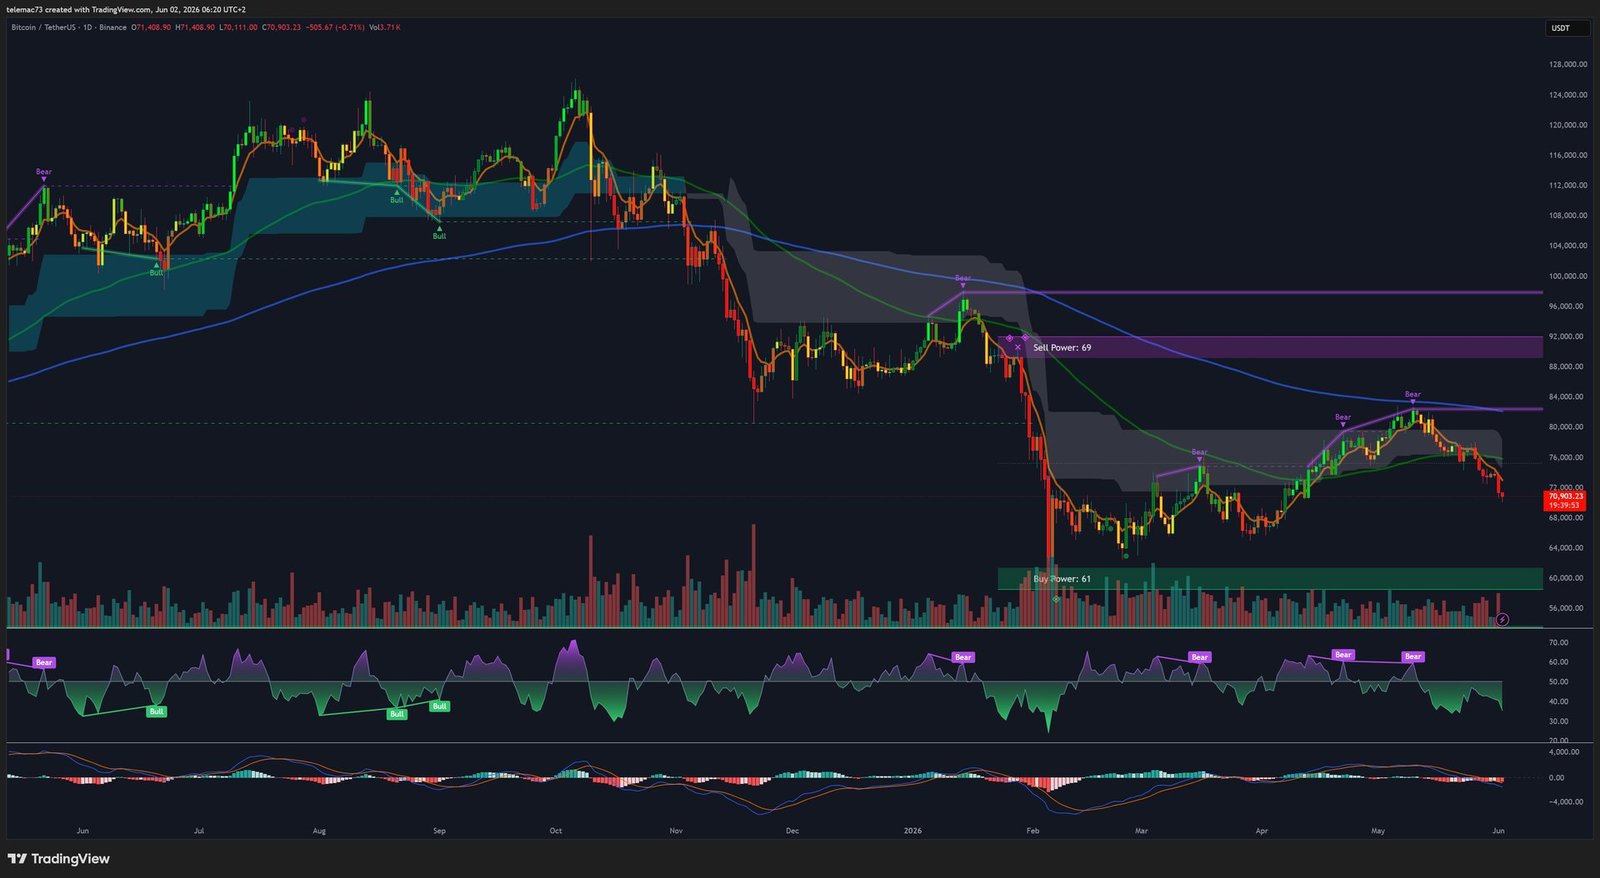
To understand the urgency of the current setup, the analysis must begin with the daily timeframe, which provides the broadest view of Bitcoin’s structural architecture since mid-2025.
The Historical Zenith and the Capitulation
The late 2025 to early 2026 period was defined by an unprecedented parabolic advance, driving Bitcoin to an all-time high of $124,000. This euphoria was accompanied by excessive leverage across the market. The reversal was severe: a cascade of forced liquidations drove the price down to a structural floor at $60,000, representing a 51.6% drawdown. The daily Ichimoku cloud subsequently flipped into a massively bearish configuration, confirming the trend reversal.
Macro Zone Geometry
Three structural zones dominate the daily chart reading:
| Structural Zone | Price Level | Technical Significance |
|---|---|---|
| Macro Resistance (Sell Power: 69) | $90,000 – $92,000 | Post-crash lower-high formation. Institutional supply distribution zone. |
| Mid-Range Pivot | $76,000 – $82,000 | Interaction zone with the daily Ichimoku cloud. Structural indecision. |
| Macro Support (Buy Power: 61) | $60,000 – $62,000 | Capitulation wick base. Long-term accumulation zone. |
At the time of this analysis, price is hovering around $70,900 — in the lower half of its macro trading range, compressed beneath a descending Ichimoku cloud acting as impenetrable dynamic resistance. The macro trend is a prolonged consolidation with a dominant bearish bias.
2. Intermediate Dynamics: The 4-Hour (4H) Timeframe
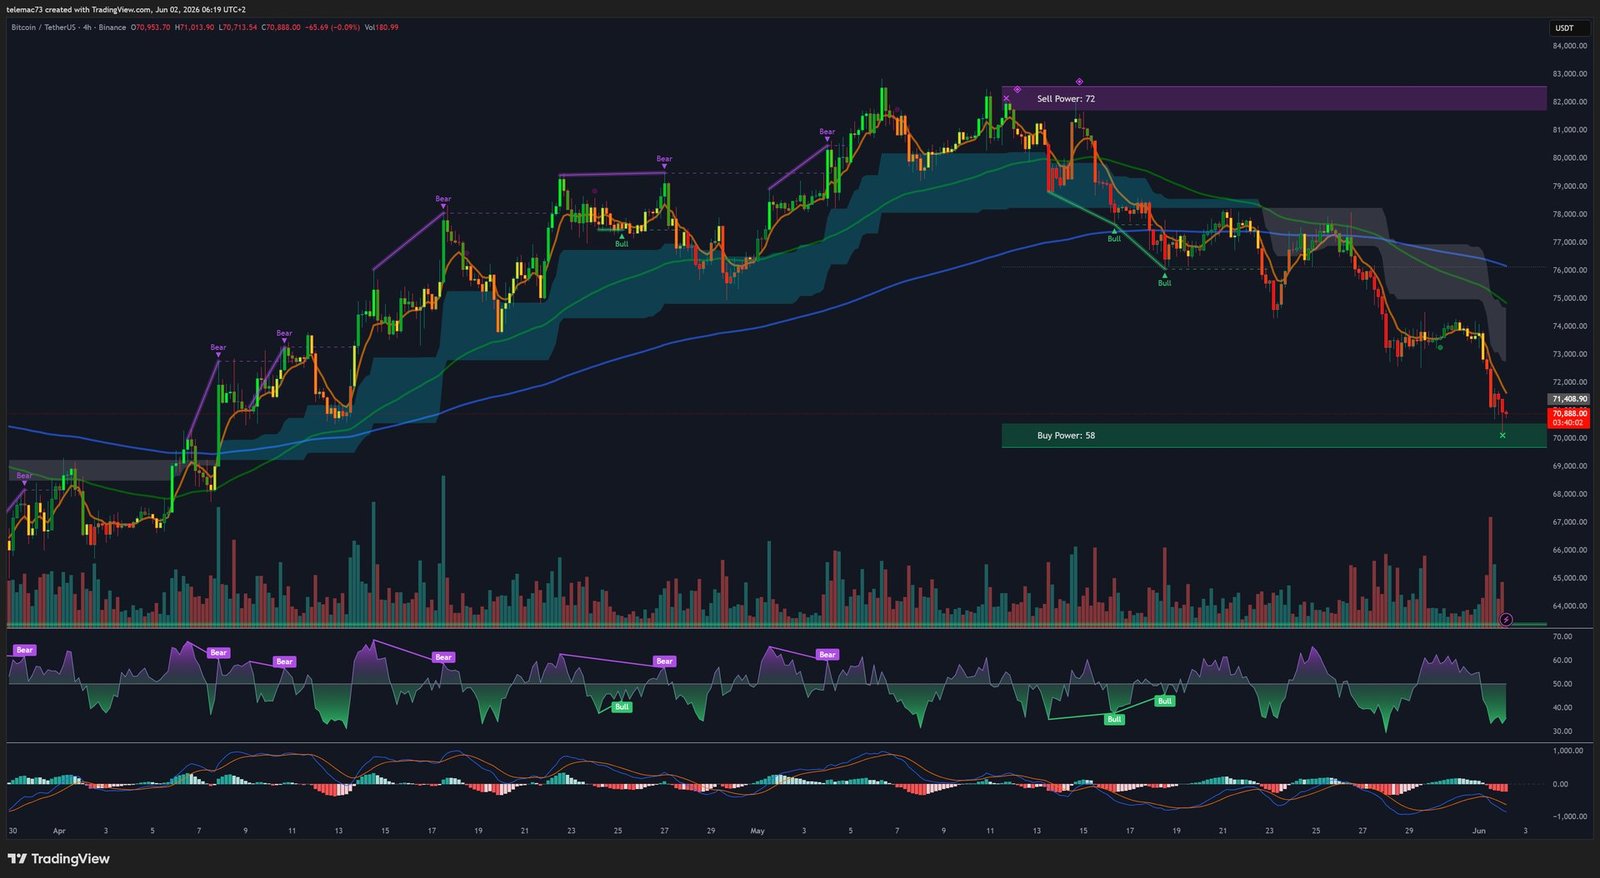
The 4-hour timeframe refines the analysis by capturing swing dynamics over the past several weeks, from mid-April through early June 2026.
The $82,000 Rejection: Bearish Trend Confirmation
In late May, BTC mounted a recovery attempt, ascending toward $82,000 and temporarily breaking above the 4H Ichimoku cloud. However, this zone represented a high-confluence resistance area (Sell Power: 72), and the rejection was violent. Price not only reversed but plunged decisively back through the cloud — a candle close below the Senkou Span B is a confirmed trend reversal signal on this timeframe.
The 4H cloud above price is now expanding in thickness, meaning any rally attempt will face increasing and compounding resistance from trapped buyers seeking break-even exits. The sequence of descending highs ($92,000 → $82,000) against a horizontal support at $70,000 carves out a classic descending triangle — the quintessential bearish continuation pattern. The 4H MACD confirms ongoing bearish momentum expansion.
The Critical Nature of the $70,000 Support
At $70,908, price is pressing directly against the Buy Power: 58 zone at $70,000. A failure of this level to absorb incoming sell volume would create a liquidity void, opening a high-probability path toward the macro floor at $60,000.
3. Intraday Microstructure: The 15-Minute (15M) Timeframe
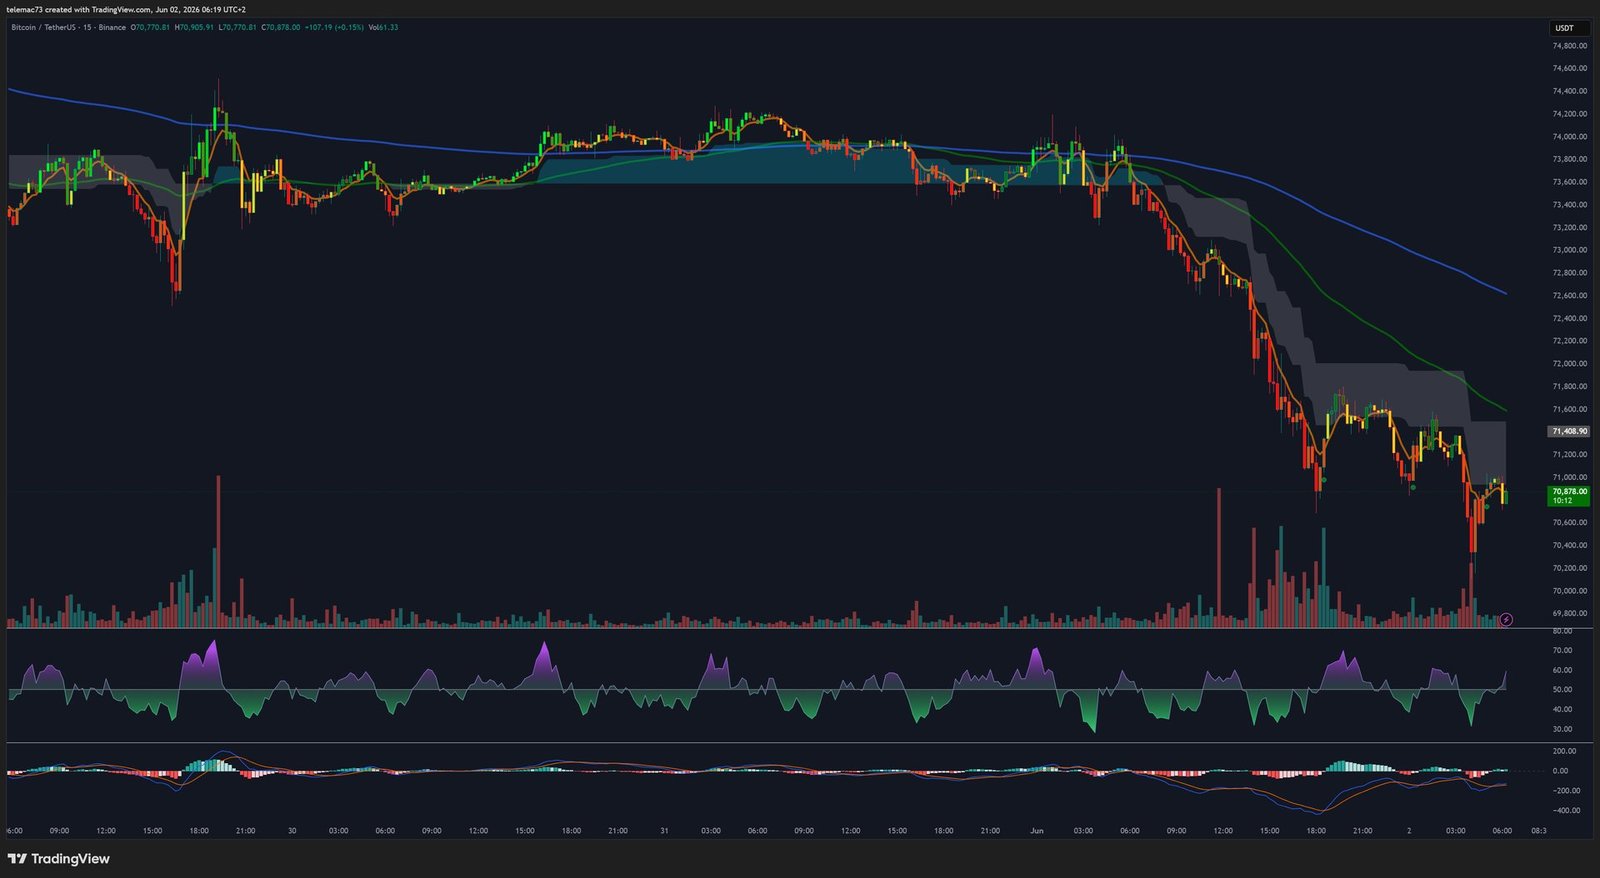
The 15-minute chart reveals the immediate urgency of the situation and the nature of the event that drove price to its current precarious level.
The Liquidation Cascade
Over a 48-hour window (late May 31 – June 2), the market was consolidating tightly near $73,800. A massive spike in sell volume triggered a violent breakdown: price collapsed from $73,800 to a local low of $70,400 — a textbook event of cascading stop-losses and forced liquidations in the derivatives market.
Bearish Divergence and Failed Bounces
Following the initial capitulation to $70,400, a weak relief bounce carried price to $71,600 before sellers re-entered, pushing it back down to $70,976. This structure — a sharp impulsive drop followed by a shallow, low-volume retracement — is characteristic of a bearish flag formation. The 15M oscillators consistently fail to cross into positive territory, and the short-term Ichimoku cloud has widened, locking in intraday resistance.
4. Liquidity Profiling: The Order Book Heatmap
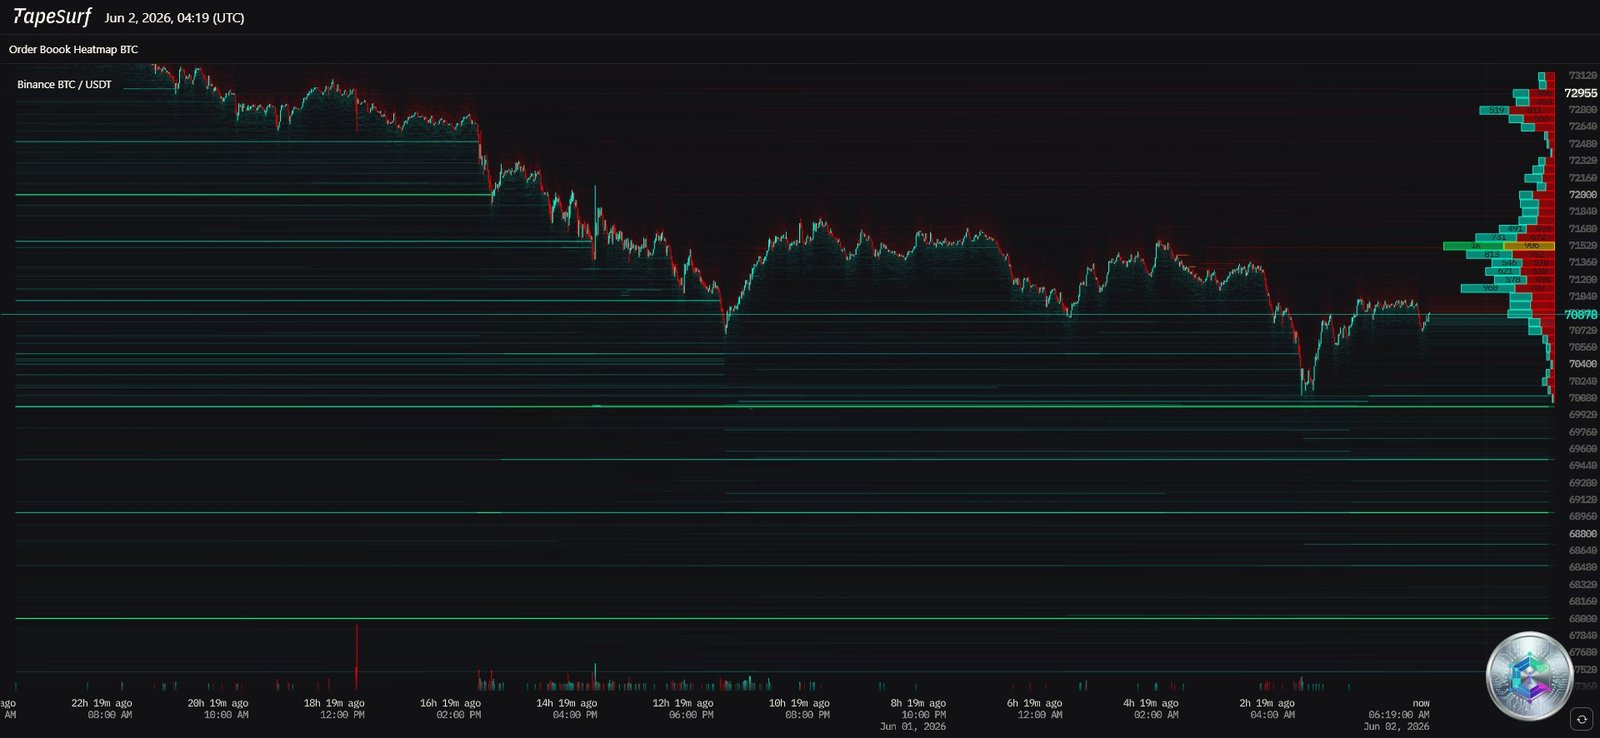
Candlestick charts map historical execution. The TapeSurf order book heatmap of Binance BTC/USDT (snapshot at 04:19 UTC) provides a forward-looking read on price attraction and repulsion zones.
The Supply Wall Overhead
The ask profile reveals a massive concentration of resting sell orders beginning at $71,520, intensifying all the way up to $72,955. Market makers and institutional players have strategically stacked sell walls precisely where the 15M and 4H charts identify technical resistance. The probability that buyers possess the capital to absorb this overhead supply is extremely low given the anemic volume observed on recent bounces.
Support Fragility and Spoofing Risk
The bid profile — resting buy orders acting as support — is notably thinner than the sell wall above. The most prominent green horizontal lines sit between $69,000 and $70,000. This asymmetry confirms the bearish bias identified on the candlestick charts. Note: the spoofing phenomenon — large fake orders cancelled before execution — can artificially inflate these levels. The true solidity of support will only be revealed when price actively trades into that zone.
| Heatmap Parameter | Status (04:19 UTC) | Market Implication |
|---|---|---|
| Immediate Resistance Density | Extremely High ($71,500–$73,000) | Bullish moves severely constrained; bounces will be sold. |
| Immediate Support Density | Moderate to Thin ($69,000–$70,000) | Vulnerable to high-volume liquidation cascades. |
| Price/Support Proximity | Compressed at $70,678 | High probability of imminent volatility expansion. |
5. Synthesis and Scenarios
Bearish Scenario (Dominant Probability)
The confluence of signals across three timeframes and the heatmap converges on a clearly bearish bias. A confirmed break below $70,000 on volume would validate the descending triangle and open the path toward the macro floor at $60,000. Institutional sellers stacked between $71,500 and $73,000 are applying constant downward pressure, and thin buyer support creates the conditions for a rapid liquidation cascade.
Bullish Scenario (Counter-Trend)
A recovery would require a massive absorption of the $71,500–$73,000 sell wall on exceptional volume, followed by a confirmed close above the 4H Ichimoku cloud. This scenario remains statistically unfavorable in the current technical context, but cannot be ruled out in the event of an unexpected macroeconomic catalyst (Fed announcement, positive ETF flows, bullish on-chain data).
Conclusion
Bitcoin stands at a major technical inflection point. Following the historic correction from $124,000, price is compressed beneath a descending Ichimoku cloud, trapped in a prolonged distribution phase. The 4H and 15M timeframes explicitly illustrate the failure of bullish momentum at $82,000 and the high-frequency bearish trauma that drove price down to test macro support at $70,000. The TapeSurf heatmap exposes an overwhelming density of sell-side liquidity above $71,500, mathematically restricting upward mobility.
The coming week will be decisive: either $70,000 holds and generates a corrective bounce, or this line breaks and the road to $60,000 opens. Either way, volatility is guaranteed.
⚠️ Disclaimer: This article is written for educational and informational purposes only. It does not constitute investment advice or a recommendation to buy or sell any asset. Cryptocurrency markets are highly volatile and past performance does not guarantee future results. Only invest what you can afford to lose and consult a qualified financial advisor before making any investment decision.

