


The end of May 2026 marks a pivotal inflection point for Bitcoin (BTC), currently trading around the $73,460 zone. The benchmark digital asset finds itself caught between deeply restrictive macroeconomic forces, major geopolitical instability in the Middle East, and a structurally shifting institutional landscape. This report provides an exhaustive dissection of these elements, cross-referenced with a multi-timeframe chart analysis (15-min, 4-hour, daily) and an order book heatmap evaluation.
1. Macroeconomic Context and Geopolitical Catalysts
The Strait of Hormuz: Epicenter of the Crisis
May 2026 was marked by an unprecedented military and economic escalation between the United States and Iran. American strikes near Bandar Abbas triggered immediate retaliation from the Islamic Revolutionary Guard Corps (IRGC), severely disrupting maritime traffic in the Strait of Hormuz — a strategic chokepoint through which 20–25% of global crude oil supply transits.
In response, the Trump administration established a naval blockade via « Operation Project Freedom ». Iran, in turn, implemented a toll system extorting commercial vessels in Bitcoin and stablecoins — approximately $1 per barrel, generating up to $2 million per supertanker to finance its war effort. WTI crude oil surged past the psychological threshold of $90 per barrel, reigniting global inflationary fears.
On May 29, 2026, a major diplomatic reversal: President Trump announced the imminent lifting of the naval blockade following a preliminary agreement with Tehran, triggering an immediate Bitcoin rebound toward $74,000.
Federal Reserve Monetary Policy and Yield Pressure
The oil shock hardened Federal Reserve rate expectations. With inflation proving stickier than anticipated, the market was forced to capitulate to the reality of a « higher for longer » policy. By late May 2026, the 10-year U.S. Treasury yield hovered around 4.6%, while the 30-year yield reached a staggering 5.197% — its highest level since 2007.
These yields offer institutional investors attractive guaranteed real returns, creating direct competition for liquidity at the expense of Bitcoin — a non-yielding asset. The persistent strength of the U.S. dollar (DXY) tightens global liquidity further, exerting continued downward pressure on BTC valuations.
Crypto Seizures and the Strategic Bitcoin Reserve
The U.S. Treasury Department announced on May 29 a cumulative total of approximately $1 billion in seized Iranian crypto assets via « Operation Economic Fury ». Simultaneously, the American Reserve Modernization Act (ARMA) of 2026 — a bipartisan bill aiming to establish a Strategic Bitcoin Reserve by locking up $26 billion in seized cryptocurrencies for 20 years — provides a powerful long-term institutional support narrative, neutralizing concerns over potential government sell-offs.
2. Institutional Dynamics and On-Chain Flows
The Spot ETF Hemorrhage
The second half of May was characterized by a massive institutional capital exodus. On May 27, U.S. spot Bitcoin ETFs recorded a colossal single-session net outflow of $733 million. This mechanism forces issuers (BlackRock, Fidelity) to unwind their underlying positions, creating a demand vacuum that facilitated the breakdown below the psychological $75,000 support level.
The Awakening of Dormant Whales
On-chain data reveals a structurally concerning phenomenon: throughout 2026, over 103,913 BTC (~$7.6 billion) have left dormant addresses. In late May alone, a new wave of 665 BTC from wallets created between 2013 and 2017 was put back into circulation within 24 hours. This historical distribution acts as a constant friction, capping the amplitude of bullish rebounds. Simultaneously, short-term holder supply dropped from 6.4 million to 4.2 million BTC — illustrating retail speculator capitulation.
Liquidation Cascades and Leverage
The derivatives market acted as a volatility amplifier. The breakdown below $75,000 triggered an algorithmic liquidation cascade: over 160,000 traders liquidated for $900 million within 24 hours, with long positions representing 93% of losses ($873M). The Trump-announcement rebound triggered the opposite effect at a smaller scale, forcing ~$5.57 million in short liquidations and propelling the price toward $74,000.
3. Order Book Heatmap Analysis
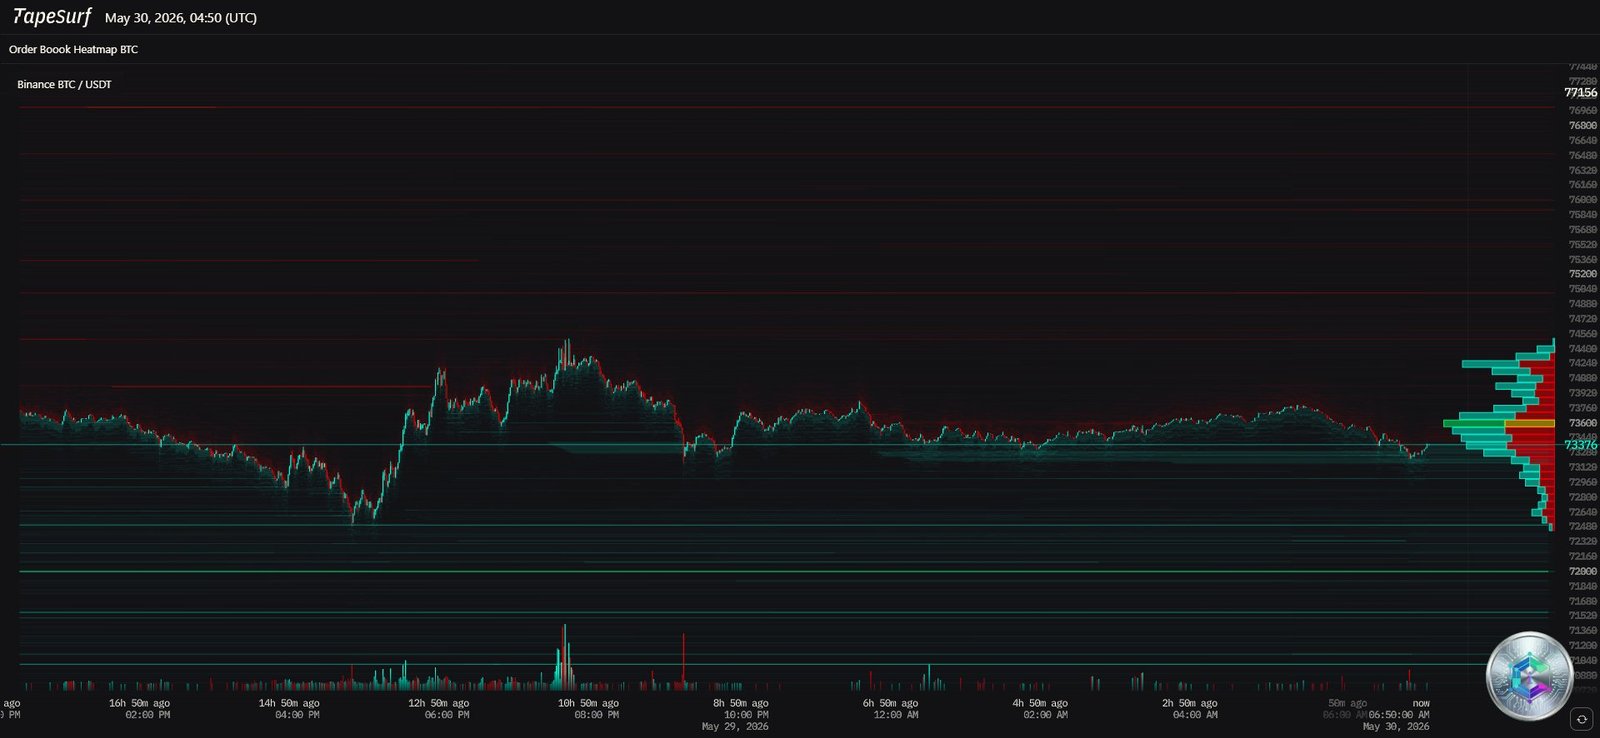
The TapeSurf order book heatmap for Binance BTC/USDT paints an unambiguous picture of the current microstructure:
- Sell Wall (Ask Liquidity): A massive blood-red liquidity concentration looms above the current price of $73,574. This algorithmic resistance block thickens critically between $73,600 and $74,400, with secondary resistance lines extending up to $76,000. Breaching this zone will require exceptional spot buying volume to absorb the stacked sell orders.
- Bid Cushion (Buy Liquidity): Below the current price, support layers (green/cyan lines) are visible between $73,200–$73,000, then stepping down toward $72,000–$71,500. These levels represent strategic buy limit orders placed by institutional players anticipating a deeper correction.
- Point of Control (POC): The highest traded volume clusters precisely around the $73,600 zone, making it a fair value level and magnetic intraday pivot point.
Takeaway: The market is heavily top-weighted by sellers. The lack of deep bid liquidity immediately below price makes the asset vulnerable to rapid drops (air pockets) should the $73,000 floor give way, while any rally attempt will be laborious against the stacked ask wall extending to $74,400.
4. Multi-Timeframe Chart Analysis
Daily Chart (D1): The Macro Structure
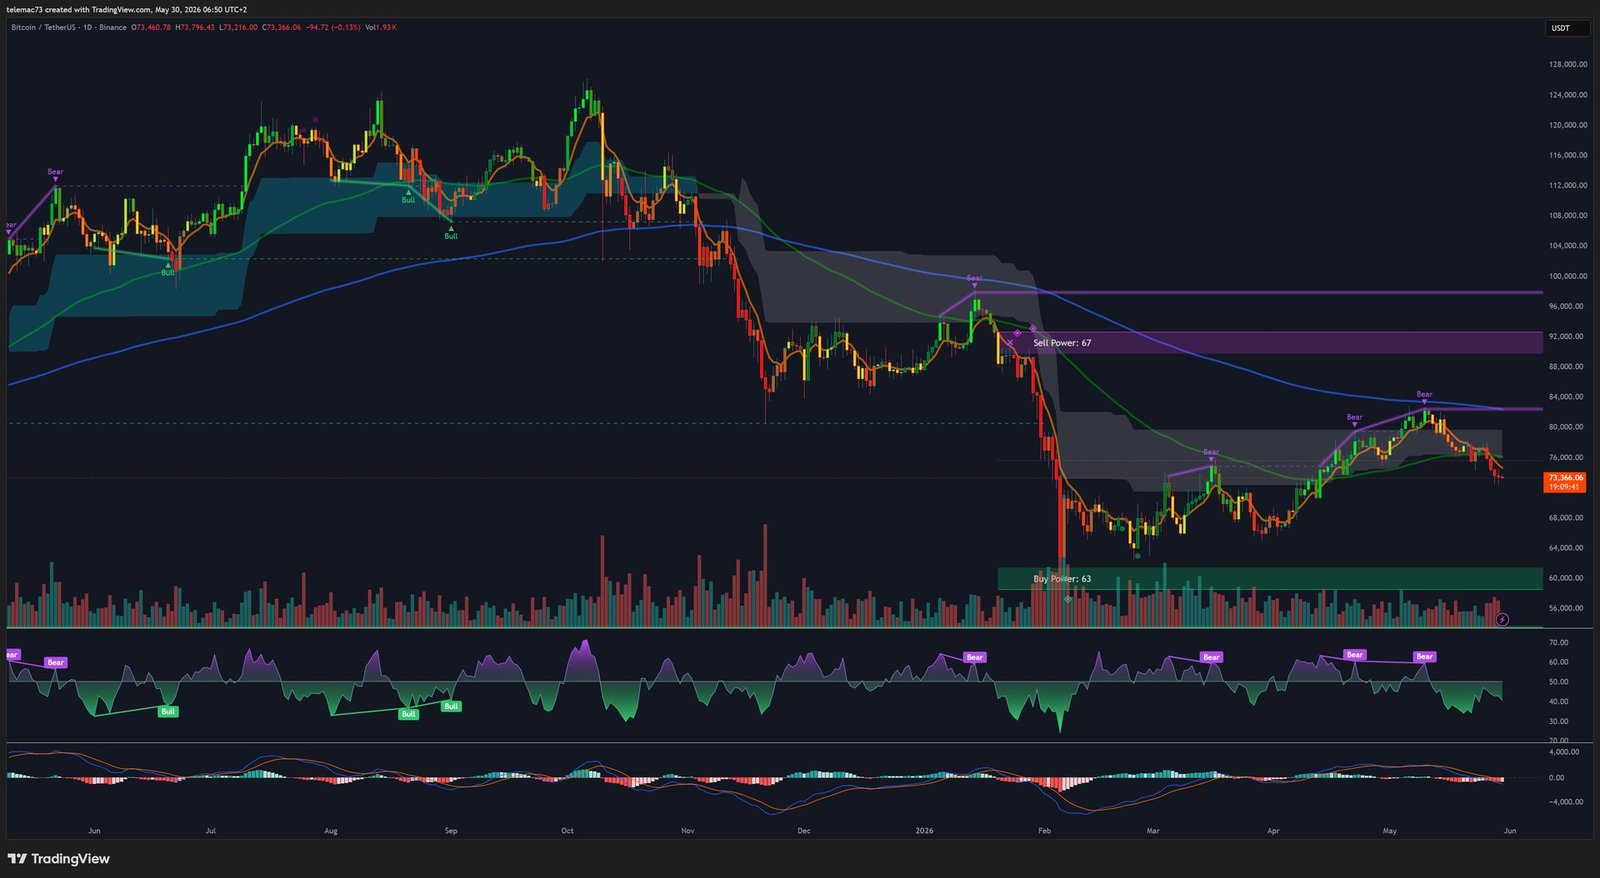
The daily chart underscores the magnitude of the correction from the ATH near $124,000 (reached in October 2025). Price currently oscillates around $73,466, in the lower half of the macro range. Two critical institutional zones dominate the structure:
- « Sell Power » (~$90,000): Historical distribution zone where supply overwhelmed demand; major institutional ceiling.
- « Buy Power » ($58,000–$60,000): Macro floor where « smart money » capital is expected to defend the asset at all costs — the ultimate accumulation zone.
The daily MACD is deeply bearish, and the chart history shows a heavy distribution structure from the highs. Long-term moving averages are exerting significant dynamic resistance above current price levels.
4-Hour Chart (H4): The Battle in Progress
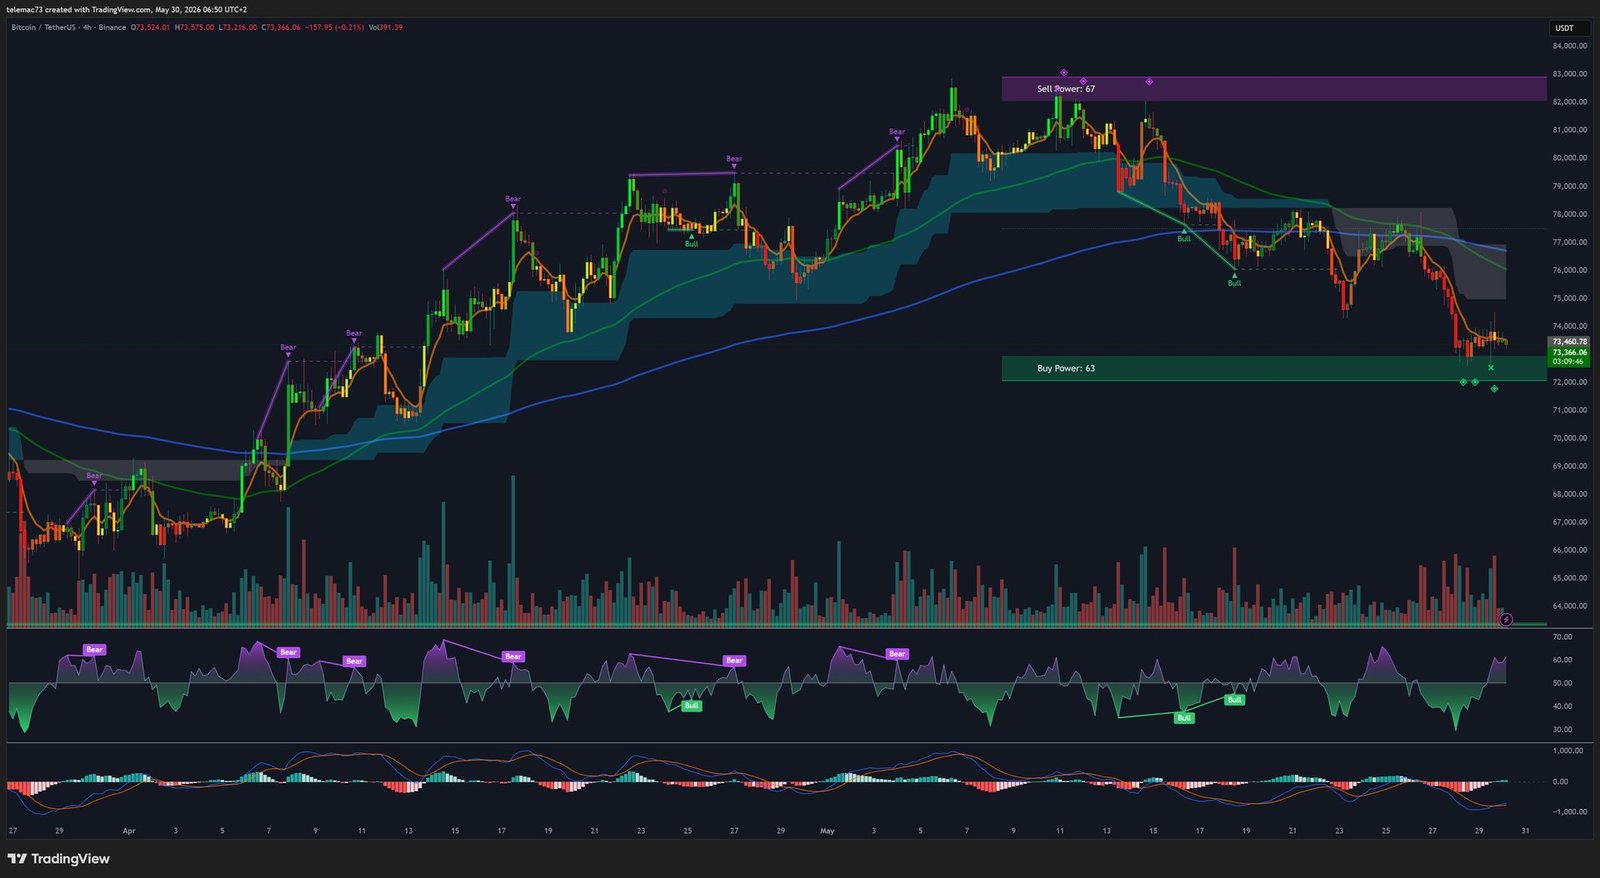
The H4 chart illustrates the ongoing battle with surgical precision. Price is sandwiched between:
- « Sell Power » ($82,000–$83,000): Recent distribution zone and institutional ceiling on the H4.
- « Buy Power » ($72,000–$73,000): The vital support zone currently under direct test.
A local Death Cross formed on short-term moving averages, following price lower. The RSI is emerging from an extreme oversold zone, indicating mathematical exhaustion of immediate selling pressure. The H4 MACD, although below zero, shows early signs of convergence — a potential nascent Golden Cross could signal a relief rally toward $76,700.
15-Minute Chart (M15): Intraday Micro-Structure
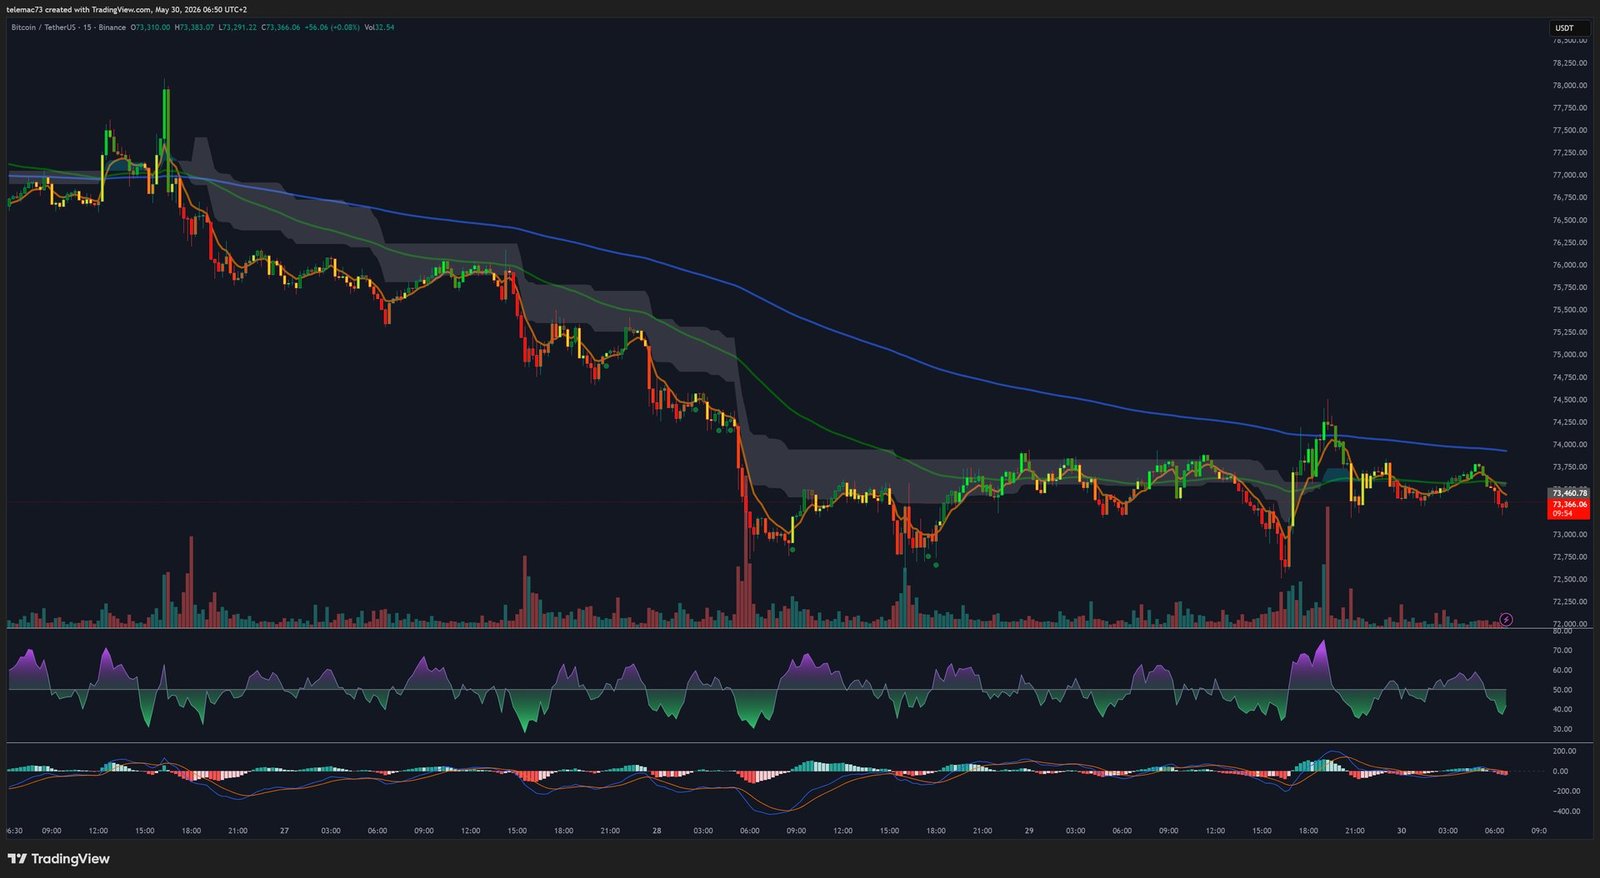
The M15 captures the violence of the recent decline from $77,000, followed by a chaotic lateral consolidation displaying the classic hallmarks of a « Bear Flag ». The structure is pinned below a descending dynamic resistance moving average. A downside resolution would trigger a new liquidation cascade. Only a sustained M15 MACD crossover above zero into positive territory would validate a genuine reversal — as opposed to a textbook dead cat bounce.
5. Key Levels Matrix
| Level Type | Price Zone (USD) | Technical Justification |
|---|---|---|
| Macro Resistance (ATH) | $122,000 – $124,000 | All-Time High, origin of the long-term bear market structure |
| Distribution Zone | $82,000 – $83,000 | Major institutional ceiling on H4, heavy sell pressure |
| Intermediate Resistance | $76,700 – $77,000 | Local spring 2026 high, origin of the last impulsive leg down |
| Sell Wall (Heatmap) | $74,400 – $75,000 | Massive Ask Liquidity block, converging descending H4 MAs |
| Central Pivot | $73,835 | Daily equilibrium zone, intraday Volume POC |
| Immediate Support | $72,000 – $73,000 | H4 « Buy Power », Heatmap bid liquidity, M15 Bear Flag invalidation |
| Psychological Support | $70,000 | Major barrier, potential long liquidation trigger |
| Macro Accumulation Zone | $58,000 – $60,000 | Daily « Buy Power », ultimate defense line against total capitulation |
6. Strategic Scenario Analysis
Scenario 1 — Geopolitical Relief Rally (Probability: Moderate)
This scenario hinges on an effective and lasting de-escalation in the Middle East. If the Trump administration formalizes and maintains the Hormuz blockade deal, oil normalization should follow. A WTI pullback below $85 would ease inflationary pressure, and a 10-year Treasury yield decline below 4.5% would revive risk appetite. Technically, BTC must break through the $74,400 sell wall with significant spot volume to invalidate the M15 Bear Flag. An H4 MACD Golden Cross would then target the $76,700 resistance. However, absent positive ETF flows, this rebound would remain a corrective lower high — not a resumption toward $82,000 — unless the ARMA bill advances unexpectedly, triggering institutional FOMO.
Scenario 2 — Macroeconomic Capitulation (Probability: Moderately High)
If the Iran ceasefire collapses and energy prices remain elevated, inflation stays « sticky. » The Fed maintains its restrictive stance, deepening ETF outflows beyond the recent $733M single-day figure. Technically, failure to reclaim the $73,835 pivot leads to a breakdown of the $72,000 floor, triggering the M15 Bear Flag and a liquidation cascade toward $70,000. The daily macro structure — dominated by a deeply bearish MACD — points to the real smart money re-accumulation zone significantly lower, in the broad $58,000–$60,000 range. A return to these levels would represent the definitive purge of speculative excess and the true end of the bear cycle that began from the $124,000 peak.
Conclusion
Bitcoin at the end of May 2026 is an asset at a crossroads, caught between the maturity of its financial infrastructure and its growing vulnerability to the vagaries of traditional macroeconomics. The charts depict a fatigued market, crushed by historical distribution, fighting for structural survival around the $73,000 zone. The resolution of this standoff will not depend on technical oscillator magic, but on the fundamental equation linking inflation, U.S. Treasury yields, institutional capital flows, and Middle East geopolitical stability.
⚠️ Disclaimer: This article is written for educational and informational purposes only. It does not constitute investment advice or a recommendation to buy or sell any financial asset. Cryptocurrency markets are highly volatile and speculative. Only invest what you can afford to lose, and consult a licensed financial advisor before making any investment decision.

