
Bitcoin on a Razor’s Edge: Full Macro, On-Chain & Multi-Timeframe Analysis — May 2026
The digital asset ecosystem is navigating a critical inflection point as May 2026 draws to a close. After reaching an all-time high of $126,198 in October 2025, Bitcoin has entered a complex macroeconomic correction with prices oscillating violently between $78,000 and $73,000. The cumulative decline of roughly 11% year-to-date in 2026 represents a fundamental transition in market microstructure: asymmetric redistribution of institutional capital, mounting exogenous geopolitical pressures, and a paradoxical maturation of underlying Web3 infrastructure.
🌐 The Macroeconomic Chessboard
Geopolitical Tensions, Energy Shock, and Monetary Policy
The most immediate catalyst behind recent volatility is the escalating tensions in the Middle East. Uncertainty surrounding a potential US-Iran peace deal triggered a flight-to-safety movement that paradoxically excluded cryptocurrencies. WTI crude oil approached the critical $95 per barrel threshold, reviving fears of cost-driven imported inflation.
Historically, such energy shocks force central banks into a constrained position. The Federal Reserve (FOMC) remains committed to its « higher for longer » monetary policy paradigm. As the risk-free rate rises, the opportunity cost of holding volatile, non-yielding assets like Bitcoin increases symmetrically — JPMorgan explicitly noted that Bitcoin ETF outflows reflect a cooling of the debasement trade as investors reassess systemic risk.
The Equity Divergence and the AI Liquidity Siphon
One of the most striking anomalies of May 2026 is the stark directional divergence between Bitcoin and US equity markets. While crypto suffers crushing downward pressure, the S&P 500 is breaking all-time highs, driven by unprecedented AI-fueled euphoria.
Nvidia epitomizes this dynamic: the company reported revenues of $81.6 billion (+85% YoY) with record net income of $58.3 billion, pushing its market cap past $5.2 trillion. Adding to this liquidity vacuum, SpaceX’s imminent IPO — with an estimated fundraise of ~$75 billion at a potential valuation near $1.75–2 trillion — is mobilizing vast institutional capital reserves at the direct expense of marginal BTC demand.
| Macro Factor | Current State (May 2026) | Impact on BTC |
|---|---|---|
| US-Iran Tensions | Uncertain escalation | Rising risk aversion, reduced speculative positioning |
| WTI Crude Oil | ~$95 / barrel | Inflation fears, Fed rates held elevated |
| Nvidia Earnings | +85% YoY, $81.6B revenue | Capital rotation into AI, crypto liquidity drain |
| SpaceX IPO | ~$75B fundraise expected | Massive capital mobilization (cash hoarding) |
| S&P 500 | New all-time highs | BTC underperforms equities |
🔗 On-Chain Fundamentals and Institutional Adoption
ETF Fatigue and Whale Hibernation
The euphoria that accompanied the SEC’s historic approval of Spot Bitcoin ETFs in January 2024 has collided with the reality of institutional profit-taking cycles. In late May 2026, Bitcoin ETFs suffered approximately $1.26 billion in net outflows over 6 consecutive trading days, nearly erasing all year-to-date inflows and leaving a precarious cumulative balance of ~$536M.
CryptoQuant’s on-chain analytics confirm this strategic retreat: accumulation metrics for whale and dolphin wallets show demand has virtually stalled. The absence of aggressive buying at historically discounted levels signals structural weakness in immediate demand — major players have adopted a wait-and-see approach in the face of macro uncertainty.
The Stablecoin Paradigm Shift
Yet price weakness should not obscure the structural revolution underway. Cash App (Block), under Jack Dorsey, has deployed USDC stablecoin payments across Solana, Ethereum, Polygon, and Arbitrum — enabling instant USD-equivalent transfers for millions of users. Simultaneously, SoFi Bank unveiled plans for SoFiUSD, the first stablecoin issued directly by a licensed US bank, targeting 24/7 global payment flows previously dominated by Tether and Circle.
These developments point to a vital analytical conclusion: blockchain infrastructure is being absorbed and institutionalized as the new global settlement layer, progressively replacing SWIFT and legacy card networks. The altcoin market has borne the brunt of this rationalization — even critical infrastructure protocols like Chainlink trade at 82% below their ATH despite their central role in DeFi.
⚡ Derivatives Market Autopsy
Late May brought a massive purge of speculative excess. Over $1.8 billion in total liquidations were generated in a short window. During a single peak 24-hour period, $928.8 million in positions were forcibly closed — Bitcoin accounting for $365.1M, Ethereum $242M, and Solana $26M.
This classic « Long Squeeze » resulted from extreme buyer bias: funding rates were strongly positive, meaning an overwhelming majority of traders were long and paying exorbitant premiums to shorts. The moment macro weakness appeared, automated margin calls triggered a devastating cascade — the very definition of a liquidity hunt.
| Derivatives Metric | May 2026 Data | Implication |
|---|---|---|
| Total Liquidations | > $1.8B | Full flush of speculative leverage |
| Peak 24h Liquidations | $928.8M | Massive capitulation event (Long Squeeze) |
| Funding Rates | Strongly positive | Excessive long bias = fuel for the downside |
📊 Multi-Timeframe Chart Analysis
Daily Chart — The Big Picture
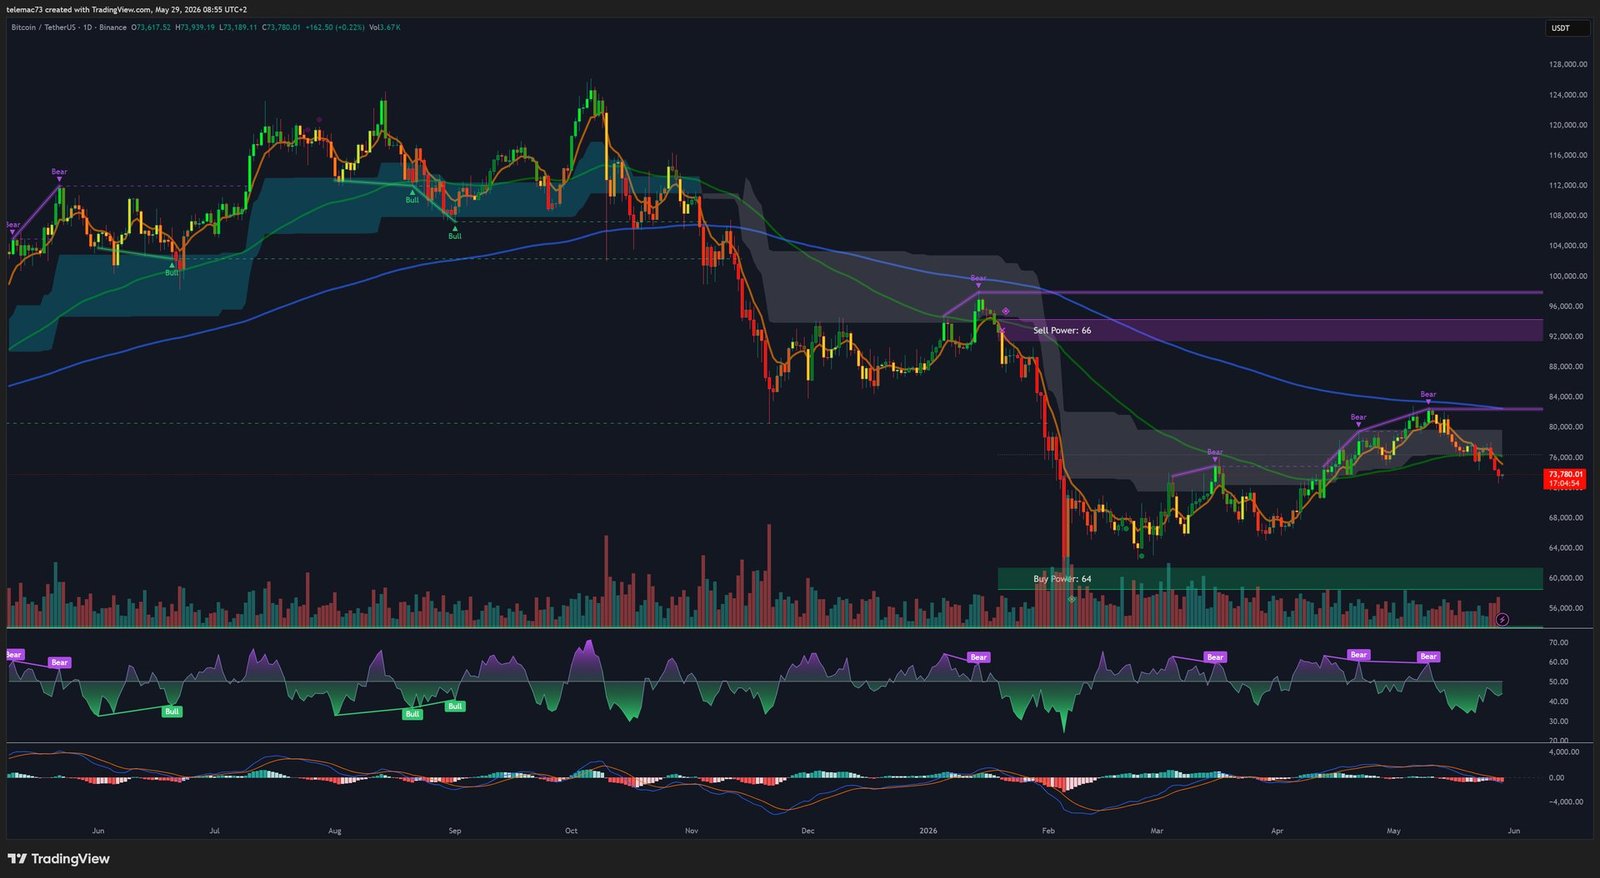
On the daily timeframe, Bitcoin is clinging to its 200-week moving average (~$73,780), a fundamental long-term macro support level. The daily MACD is deeply negative with a validated Death Cross, the histogram diving with no sign of convergence. However, the daily RSI is testing the extreme oversold zone (below 30), with a slight uptick suggesting seller exhaustion — a contrarian signal that often precedes trend reversals.
4-Hour Chart (H4) — The Bear Flag
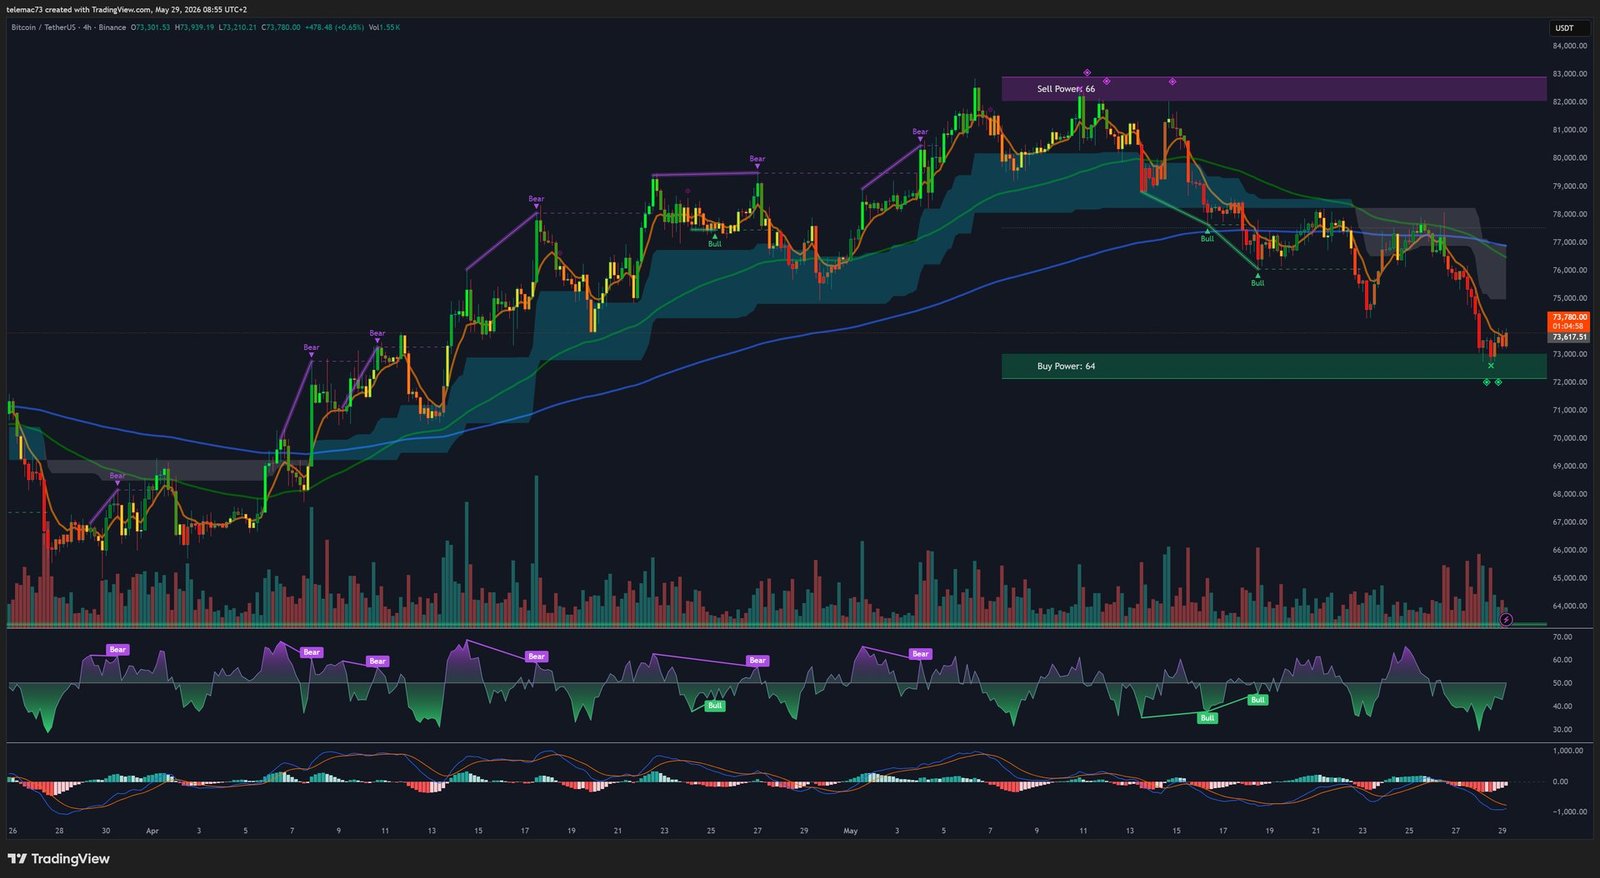
The H4 timeframe shows a dominant bear flag / descending channel pattern: lower highs (~$78,000) and lower lows forming a classic bearish compression structure. Algorithmic « Bear » signals cap each recovery attempt, while the trend cloud (modified Ichimoku-style) transitions from green to red, confirming deteriorating market polarity.
The H4 RSI reveals a potential bullish divergence (price making new lows while RSI refuses to confirm), a setup that frequently precedes breakouts from compression patterns. Failure to hold $73,700 would mechanically project price toward $65,000.
15-Minute Chart (M15) — The Microstructure
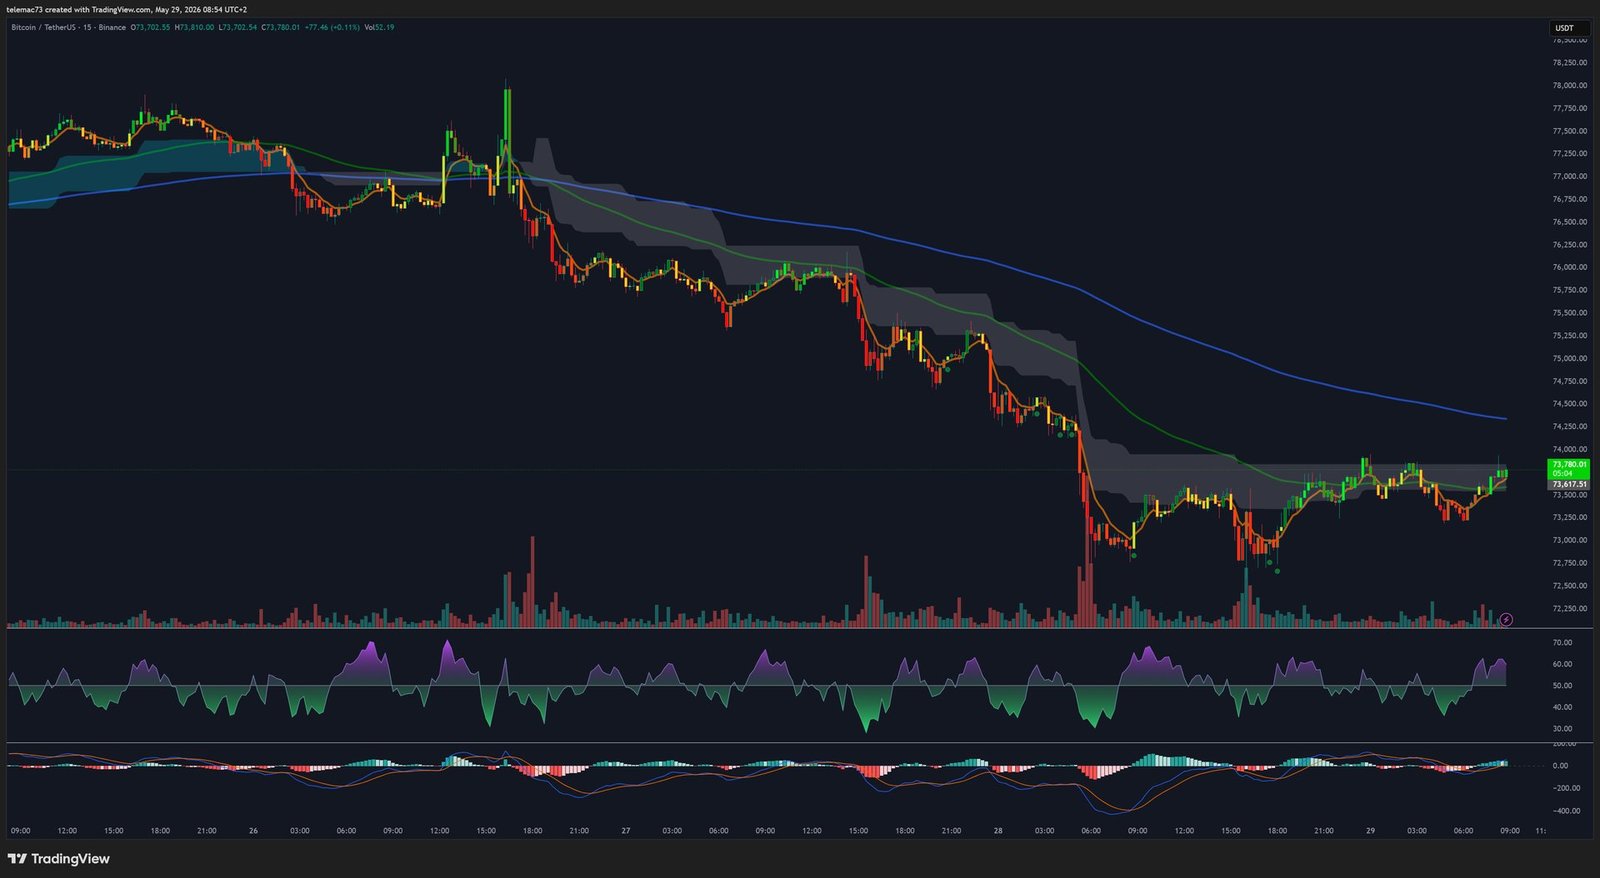
The M15 chart acts as a microscope on the recent liquidation cascade: a near-vertical drop (flash crash) from ~$77,000 to $73,780, followed by a symmetric compression triangle. The M15 RSI hit extreme levels below 20 during the crash — statistically unsustainable deviation. The M15 MACD is now showing an early Golden Cross well below the zero line, suggesting a relief bounce toward $74,500–$75,000 to fill the order book imbalance left by the liquidity hunt.
Liquidity Heatmap
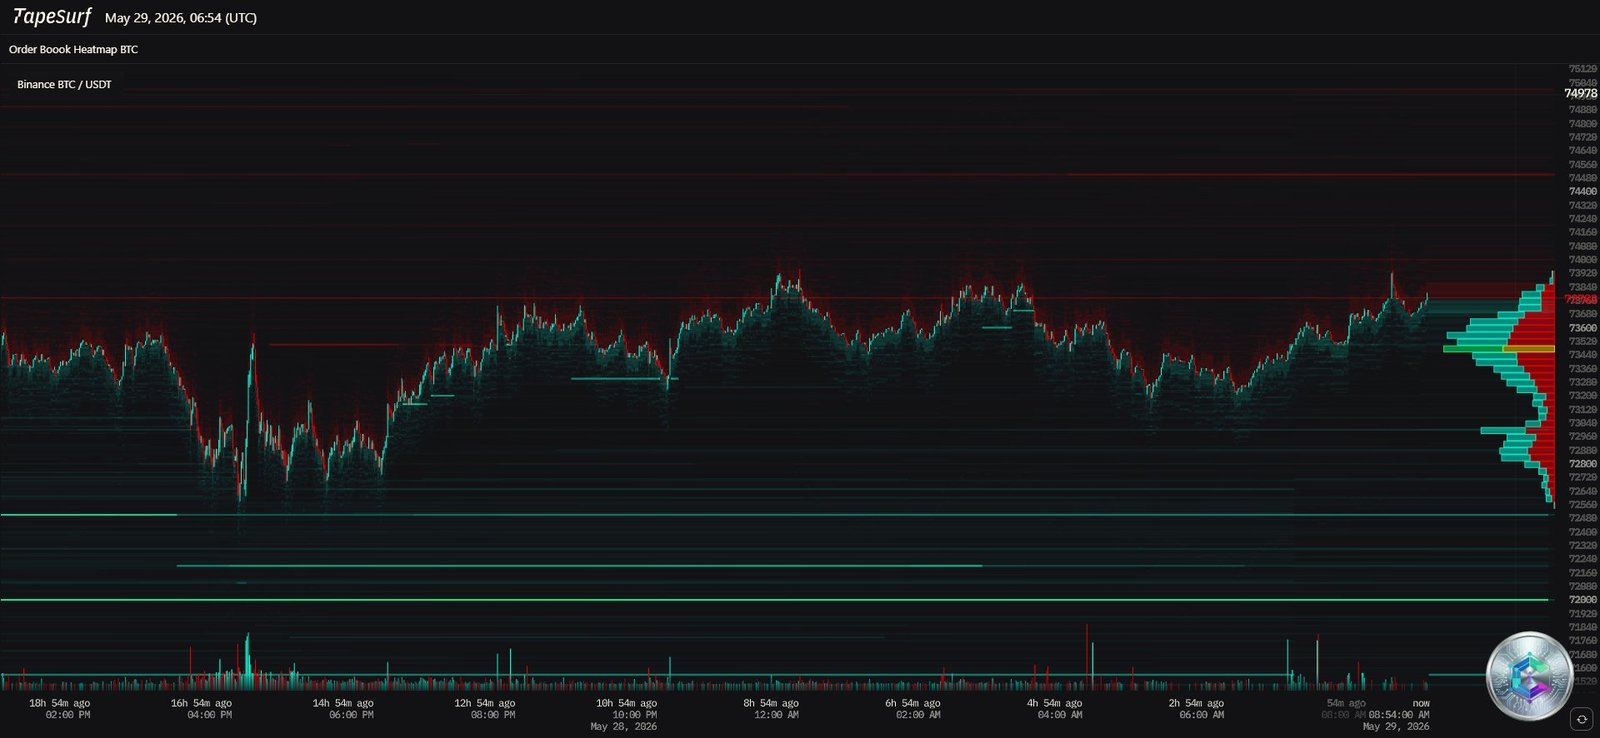
The heatmap exposes a massive sell-side order wall clustered between $74,500 and $75,000, capping any meaningful recovery attempt. Below current price, the $72,000–$73,000 zone concentrates the last significant buy-side liquidity — a clean break would accelerate the decline toward $65,000.
| Key Level | Price (USD) | Technical Significance |
|---|---|---|
| Institutional Ceiling | ~$80,000 | Major resistance / Options Call Wall |
| Intermediate Resistance | ~$78,000 | Algorithmic rejection zone |
| Pivot (21 WMA) | ~$75,800 | Intermediate trend demarcation line |
| Sell Wall (Heatmap) | $74,500–$75,000 | Dense limit order cluster |
| Current Price (Battle) | ~$73,780 | Post-liquidation micro equilibrium |
| Floor Support | $72,000–$73,000 | Critical historical bounce zone |
| Capitulation Target | ~$65,000 | Bear Flag H4 breakdown target |
🔮 Probabilistic Scenarios
Bullish Scenario (Base Case)
If the $72,000–$73,000 defense zone holds as a solid floor, an algorithmic reversal mechanism could trigger. Quantitative models (Intellectia.ai) project a potential short squeeze targeting $80,500 by end of May 2026 — representing a 4.5% to 9% appreciation from current lows. Elliott Wave theory supports this thesis, identifying the current multi-week corrective sequence as the end of Wave 4, building kinetic energy for the macro bullish Wave 5.
Bearish Scenario (Downside Risk)
Continued AI market dominance (Nvidia’s gravitational pull) combined with a potential deterioration of the Iran situation could force institutional margin call liquidations across asset classes. A definitive break below $72,000 would resolve the H4 bear flag to the downside, targeting $65,000.
Secular Outlook
The long-term macro perspective remains structurally bullish. The supply-reducing impact of the 2024 halving and the accelerating TradFi integration (Cash App, SoFi) support annual projections for 2026 ranging from $75,000 to $118,296, with the most optimistic models targeting $150,000.
📌 Strategic Conclusion
At the confluence of violently opposing cyclical forces, Bitcoin paradoxically displays its strongest-ever fundamental base (institutional blockchain adoption becoming the norm) while short-term dynamics are suffocated by hostile macroeconomic machinery and an AI liquidity siphon. The current environment disqualifies the use of speculative leverage. The painful consolidation observed through the lens of deep oversold indicators classically represents the necessary prelude to the formation of a solid market bottom.
⚠️ Disclaimer: This article is published for educational and informational purposes only. It does not constitute investment advice, nor a recommendation to buy or sell digital assets or any other financial instrument. Cryptocurrency markets are extremely volatile. Investing carries the risk of capital loss. Always do your own research (DYOR) and consult a qualified financial advisor before making any investment decision.