


Bitcoin is navigating one of its most technically dense consolidation phases of 2026. After printing an all-time high of $126,250, the asset has shed approximately 11% year-to-date, oscillating within a narrow corridor between $76,700 and $77,200 in the aftermath of the Memorial Day extended weekend. Beneath this surface-level stillness lie profound structural shifts driven by massive institutional flows, persistent geopolitical tensions, and a complete repricing of global monetary policy expectations. Here is a comprehensive breakdown.
A Paradoxical Macroeconomic Backdrop
Global financial markets in May 2026 present a striking set of contradictions. On one hand, the Dow Jones has crossed the historic 50,000-point milestone for the first time in history, while the S&P 500 has extended its winning streak to eight consecutive weeks — the longest run since December 2023. On the other hand, the Federal Reserve is sending signals that are systematically undermining risk appetite for marginal assets like Bitcoin.
The early-year narrative of multiple rate cuts has been brutally invalidated by persistent inflation data. According to the CME’s FedWatch tool, the implied probability of a rate hike before year-end 2026 has surged from just 1% to over 45%, with some monetary models pricing in a 60% probability of further tightening. 30-year US Treasury yields are testing levels unseen since 2007, and Bank of America’s Global Fund Manager Survey (FMS) reveals that 62% of institutional managers now consider it more likely that the 30-year yield will breach 6% than fall back below 4%.
This bond market liquidation has produced an unprecedented phenomenon: institutions are using spot Bitcoin ETFs — highly liquid and transparent — as emergency liquidity buffers to fund their AI-related equity exposures. The historic BTC/Nasdaq correlation has fractured: during the post-Memorial Day sessions, the S&P 500 rallied +0.66% while Bitcoin declined 1.07%, marking its third consecutive decorrelation session.
| Macro Indicator | Value / Status (May 2026) | Impact on Bitcoin |
|---|---|---|
| Fed Rate Hike Probability | 45–60% by end-2026 | ⚠️ Bearish — strengthens DXY, drains liquidity |
| US 30-Year Treasury Yield | Trending toward 6% | ⚠️ Bearish — raises opportunity cost |
| Net Bitcoin ETF Flows (May) | Outflows > $1.25B | 🔴 Directly bearish — mechanical sell pressure |
| Equity Exposure (BofA FMS) | Net overweight +50% | ↔️ Decorrelation — equities absorb capital |
| BTC Implied Volatility | 9-month low | ⏳ Neutral — historically precedes major directional move |
ETF Flow Pressure and On-Chain Dynamics
Bitcoin’s transformation into an institutional-grade asset means that ETF flow analysis is now as critical as any moving average study. The May 2026 data tells a clear story: over six consecutive days, net outflows from spot Bitcoin ETFs drained the market of over $1.25 billion. A single day on May 18th saw redemptions reach $649 million — the largest single-day outflow since January 2026.
These outflows generate mechanical selling pressure on centralized exchanges (Binance, Coinbase), systematically capping any recovery attempts at major resistance levels. On-chain data, however, reveals a significant countertrend: entities such as MicroStrategy continue their strategic accumulation, having become the largest corporate holders of Bitcoin in the world. Meanwhile, daily transaction counts on the Bitcoin network remain above levels recorded at previous price peaks — a fundamentally constructive long-term signal.
The Liquidation Heatmap: Hunting for Liquidity
The liquidation heatmap (Coinglass / Binance) has become one of the most powerful tools in modern crypto analysis. It maps the exact price levels where massive clusters of leveraged derivative positions will be force-closed by exchange risk engines, acting as magnetic zones for price action.
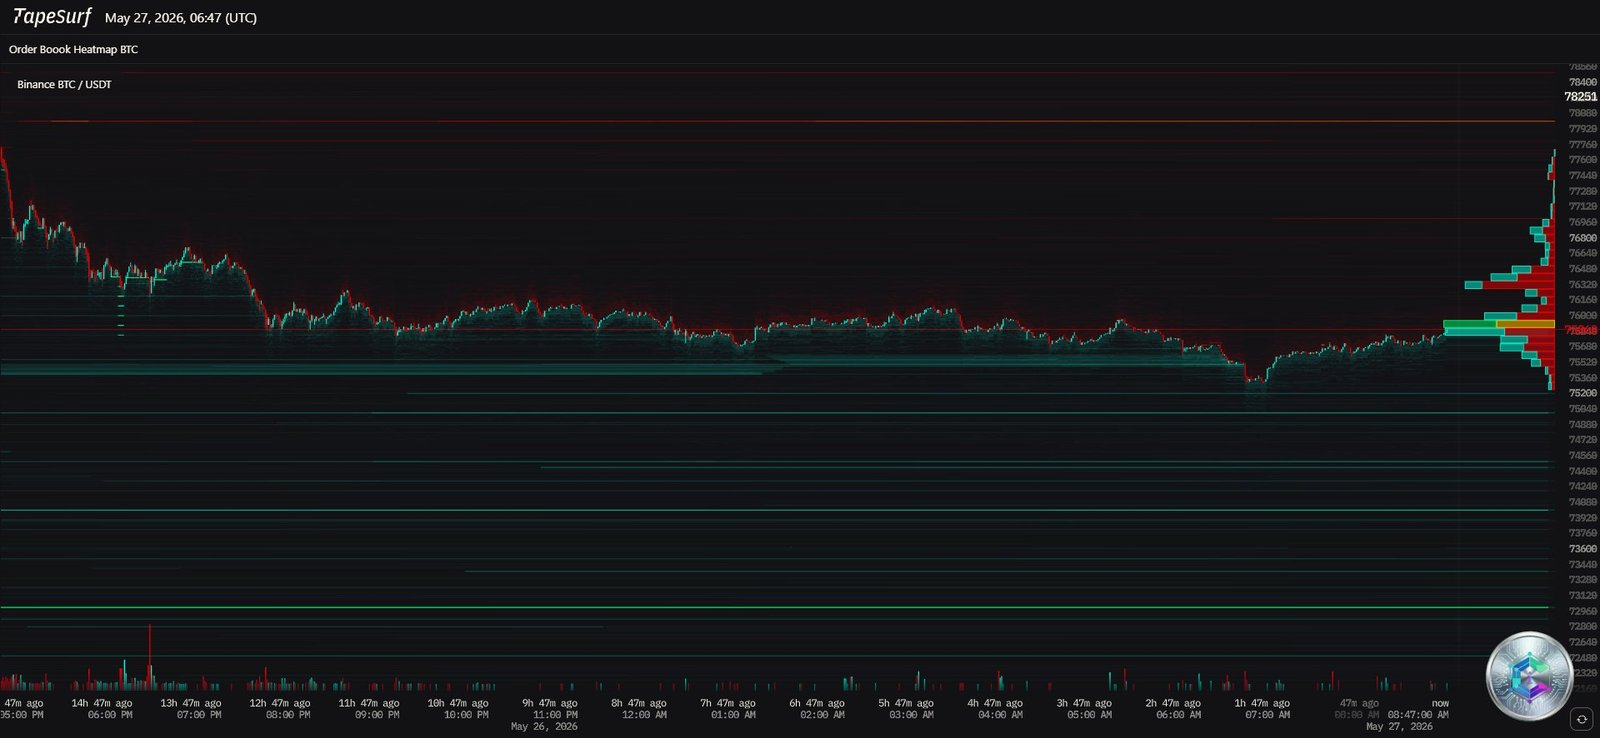
The weekend of May 23–24 was the scene of a particularly violent liquidation event: Bitcoin plunged to $74,344, wiping out nearly $917 million in positions within 24 hours. The composition of those liquidations is revealing: during the May 18th drawdown, 89% of liquidated positions were longs ($584M of $657M total). This extreme asymmetry proves the market was structurally overbought — an imbalance now substantially corrected.
The current heatmap reading highlights two critical magnetic zones:
- Support zone ($74,298 – $74,943): Residual long pockets; likely algorithmic sweep target.
- Upside magnet zone ($94,000 – $98,000): Heavy short clusters. If Bitcoin reaches these levels, triggering a massive short squeeze could propel price toward $100,000.
Multi-Timeframe Chart Analysis
Daily Chart (1D) — Moving Average Pressure
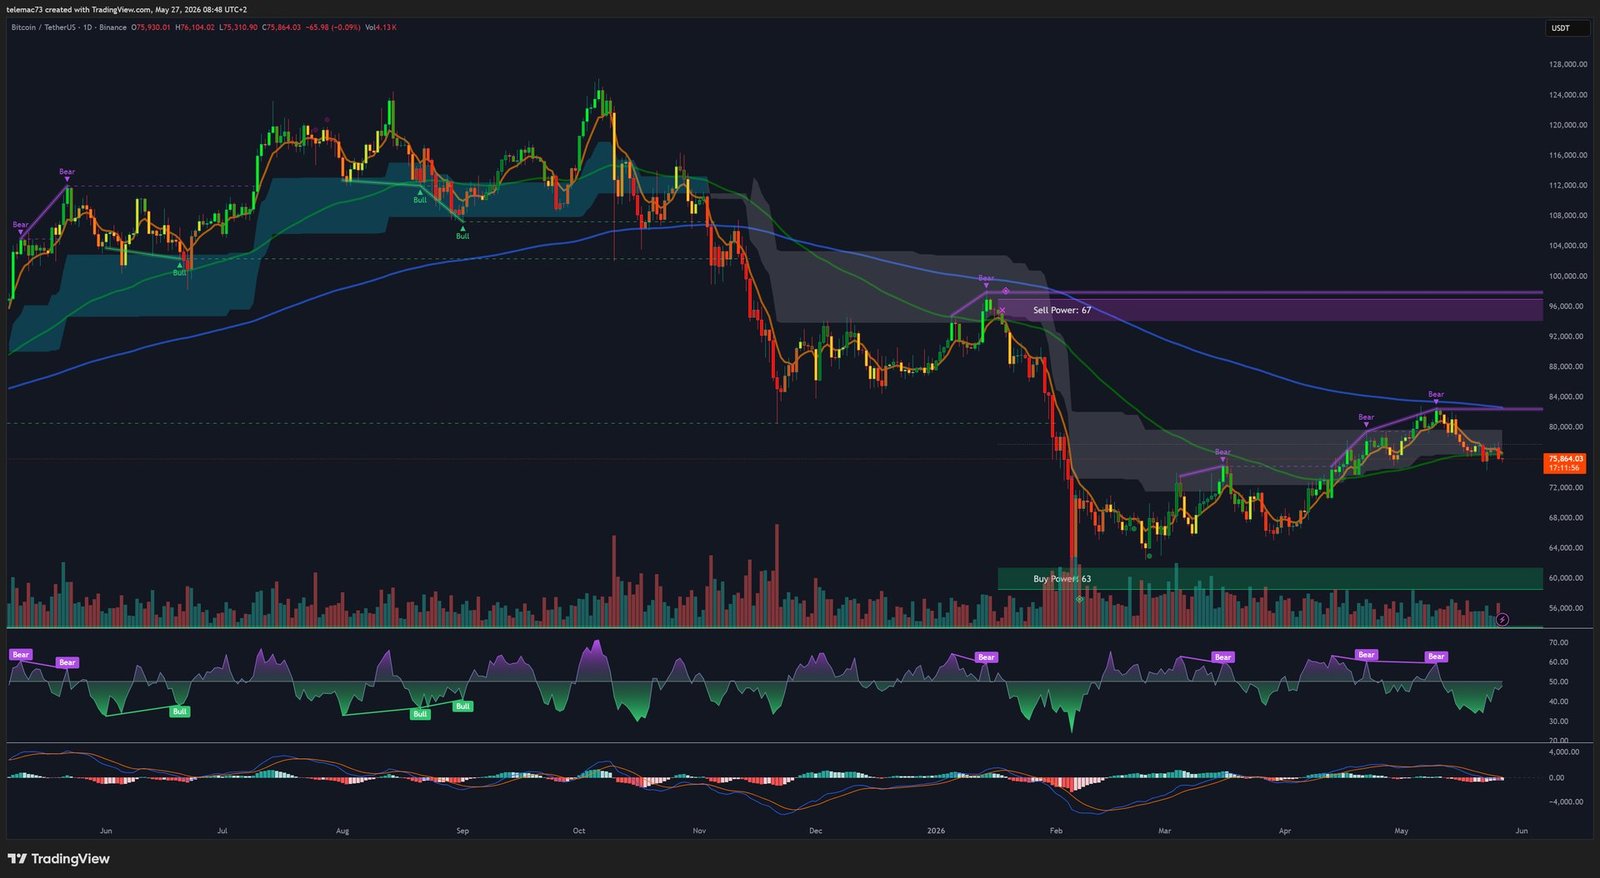
On the daily scale, the technical picture is clearly seller-controlled. Bitcoin is trading below its 20, 50, 100 and 200-day EMAs, and the recent failure to reclaim the 50 EMA has reinforced the bearish consolidation structure. The daily RSI sits at 43 — a neutral-to-bearish reading — without signaling oversold conditions that would trigger algorithmic buy programs. The daily MACD still lacks a convincing « Golden Cross, » maintaining negative momentum. A « Death Cross » (50 SMA crossing below the 200 SMA) remains a risk if consolidation persists below $75,000. On a longer-term horizon, the 200-week SMA provides a critical macro safety net in the $52,000–$58,000 region.
4-Hour Chart (H4) — The Bear Flag Trap
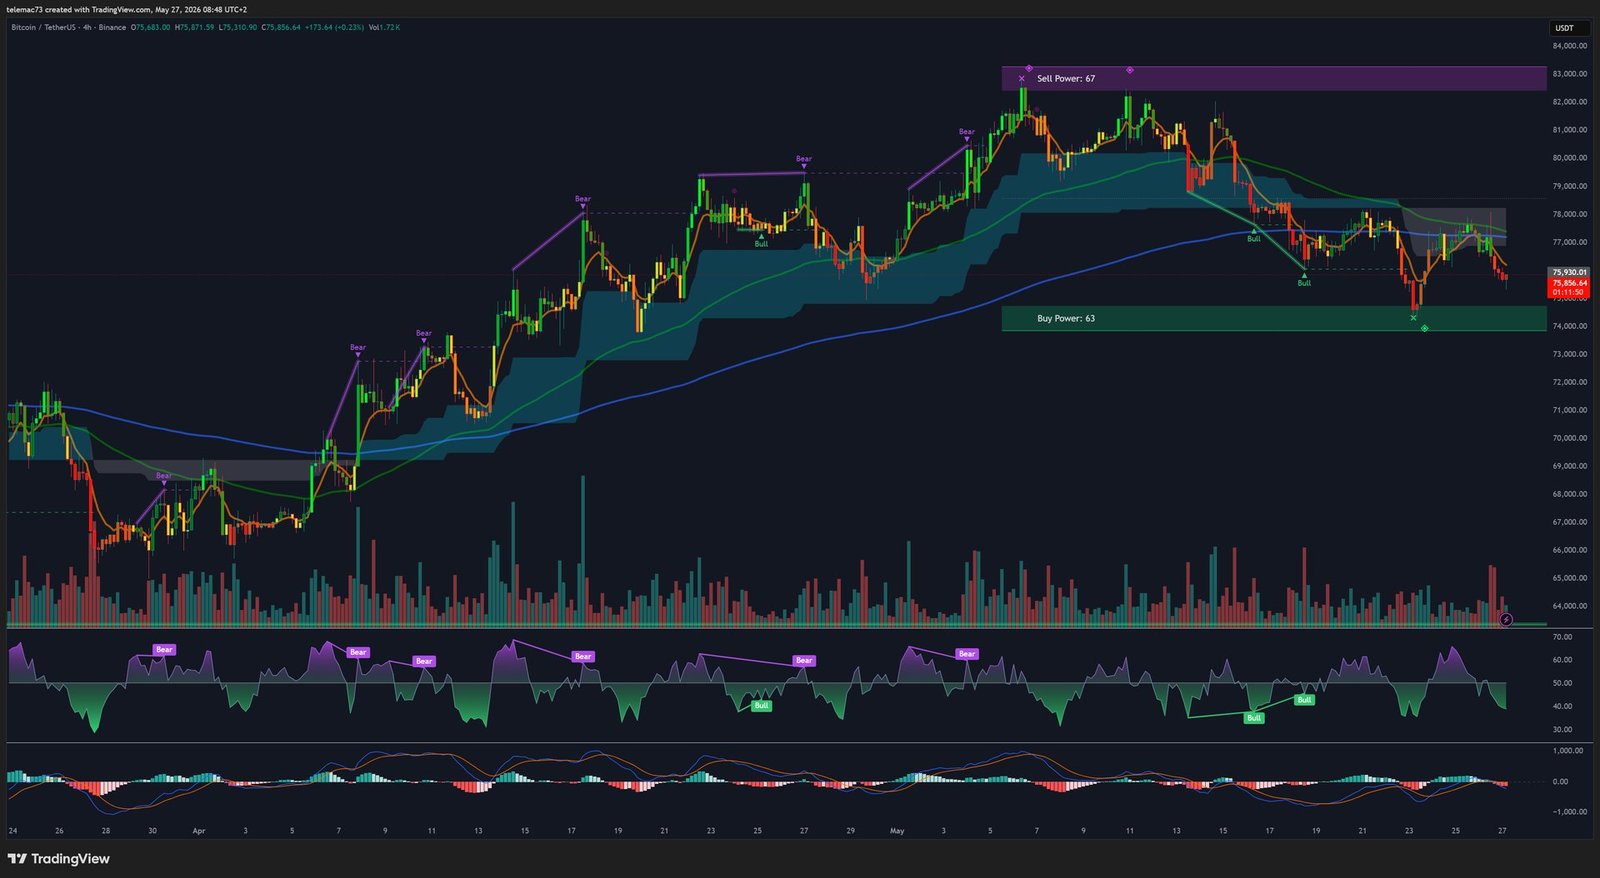
The H4 chart reveals a precisely defined indecision channel: support at $74,298 / resistance at $78,095. Over the last seven trading days, Bitcoin has attempted three times to break above the $78,000 resistance — each attempt was swiftly rejected, demonstrating heavy institutional presence defending options strike prices. The sequence of lower highs from these rejections has formed a bear flag pattern on H4, suggesting the short-term downtrend is not yet exhausted. The algorithmic precision of Fibonacci retracement levels (ceilings at $77,655, $78,042, and $78,595 on every rally) confirms the HFT-driven nature of these moves.
15-Minute Chart (M15) — The Symmetrical Triangle
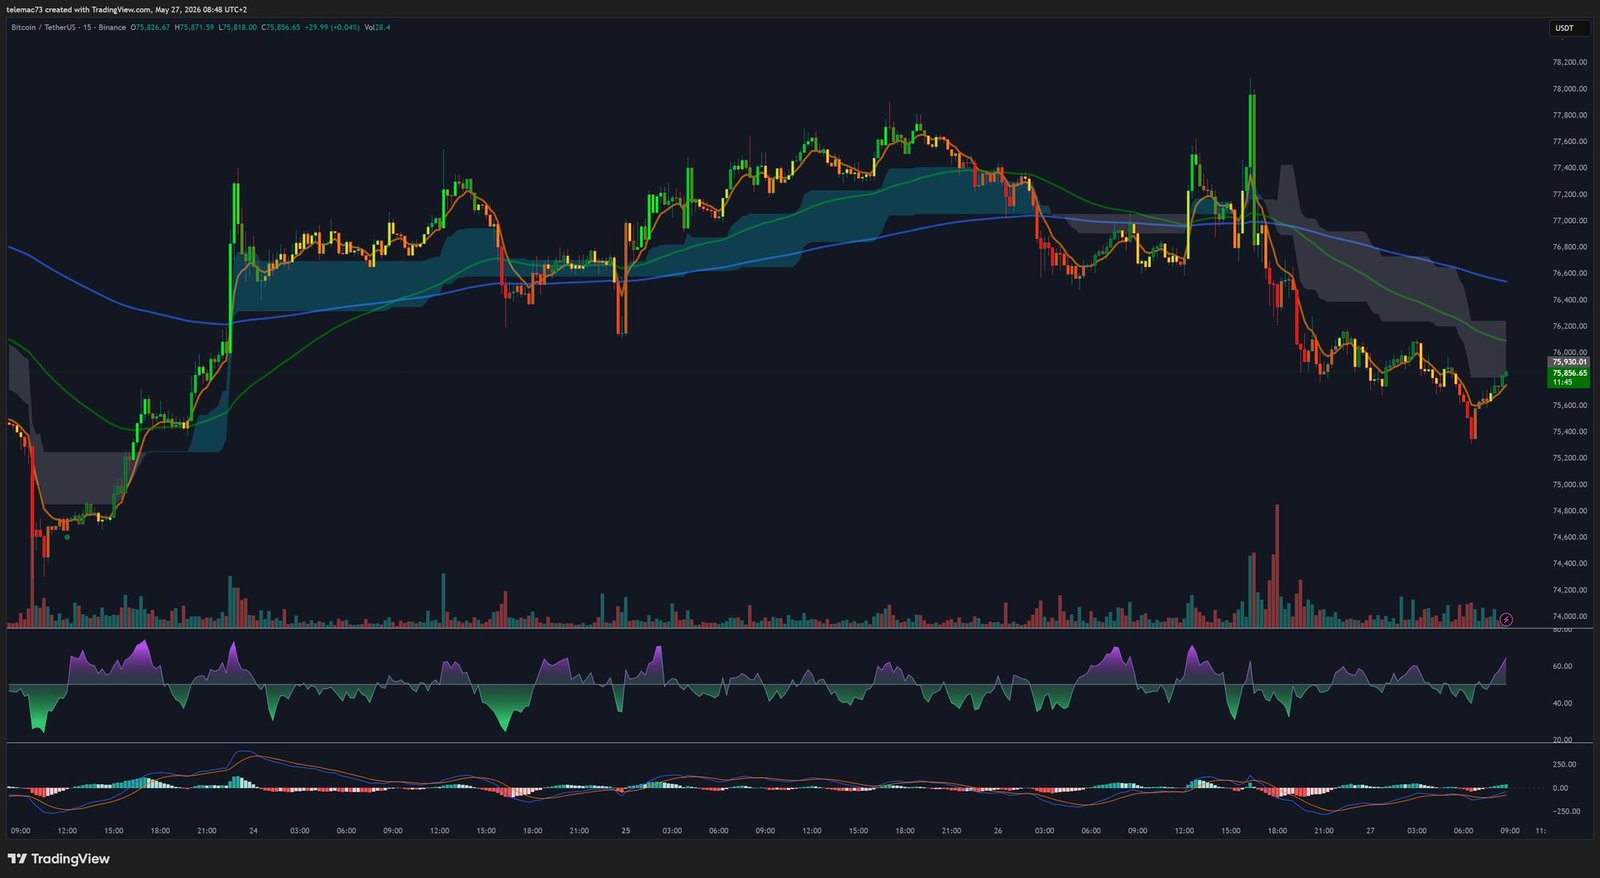
The M15 microstructure reveals the most decisive pattern of the moment: a Symmetrical Triangle, with converging trendlines approaching an imminent apex. The precise coordinates logged on May 24th: upper resistance trendline at $77,295, lower support trendline at $76,185, with a base amplitude of ~$1,110. This pattern reflects extreme volatility compression and precarious equilibrium between buyers and sellers — a setup that historically resolves in an explosive directional breakout. A validated bullish breakout above $77,295 would target $76,730 as an intermediate objective, with longer-term projections toward $89,050. Critical warning: short timeframes are prone to fakeouts — only a significant volume surge on the breakout candle constitutes reliable confirmation.
The Broader Ecosystem: Ethereum ETFs and Altcoins
No Bitcoin analysis is complete without accounting for the broader sectoral dynamics. The SEC’s approval of spot Ethereum ETFs triggered a notable rotation into DeFi and smart contract platforms, temporarily diluting Bitcoin dominance. The XRP case is particularly instructive: despite five US-listed ETFs and $1.53B in inflows since November 2025, XRP trades at -62% from its 2025 peak. The reason? Ripple’s network usage relies overwhelmingly on fiat currencies and the RLUSD stablecoin rather than XRP as a bridge currency — proving that an ETF’s existence no longer guarantees price appreciation in 2026 without genuine on-chain utility. The market has professionalised: real cash flows and bond-market safety now compete directly with narrative-driven speculation.
Two Forward-Looking Scenarios
🔴 Bear Case — Structural Breakdown
If macro data continues supporting the Fed rate-hike hypothesis, the Dollar Index (DXY) will likely extend its rally. A daily close below $74,298 would invalidate the current consolidation structure, opening the path toward $71,000 and potentially revisiting the 2024 macro bases between $60,000 and $63,000. This scenario would confirm a Death Cross formation and extend the cyclical bear trend.
🟢 Bull Case — Rebound and Short Squeeze
If the M15 symmetrical triangle breaks upward with volume confirmation, and the $75,000 pivot holds as an absolute floor, Bitcoin could mount a challenge toward $78,000. A validated break of this resistance would trigger a cascade of buy-stop orders. Pulled by the gravitational force of the massive short liquidation clusters between $94,000 and $98,000, price could experience a violent short squeeze, potentially targeting $100,000.
| Price Level | Role | Significance |
|---|---|---|
| $94,000 – $98,000 | Resistance / Upside Magnet | Short Squeeze Zone — bull case target |
| $78,095 | Critical H4 Resistance | Triple top — key trigger for recovery |
| $75,000 | Major Psychological Pivot | Bull case absolute floor |
| $74,298 – $74,943 | Immediate Support | Residual long liquidation zone |
| $71,000 – $73,000 | Deep Support | Mid-term structure invalidation |
| $60,000 – $63,000 | Fundamental Macro Support | 2024 base — ultimate cycle invalidation |
Conclusion: Patience as a Trading Discipline
Bitcoin in May 2026 stands at a critical inflection point, caught between the maturity of an ETF-dominated market structure and the headwinds of a restrictive macroeconomic environment. The collapse of implied volatility to a 9-month low is a historically significant warning signal: this type of compression almost invariably precedes a major directional move. Professional operators should prioritize strict observation of key pivot levels, validation of breakouts through volume and institutional ETF flow confirmation, and defer aggressive directional bets in favor of rigorous quantitative risk management.
⚠️ Disclaimer: This article is written for educational and informational purposes only. It does not constitute investment advice, nor a recommendation to buy or sell any digital asset. Cryptocurrency markets are highly volatile and past performance is not indicative of future results. Only invest what you are prepared to lose and consult a qualified financial advisor before making any investment decision.

