


Bitcoin’s market is navigating a pivotal transition phase in late May 2026, defined by a deep divergence between short-term price compression and a long-term reconfiguration of capital flows. This report presents a rigorous structural market analysis of BTC, drawing on order book liquidity mapping (heatmap), multi-timeframe chart analysis (15-minute, 4-hour, daily), and the integration of dominant macroeconomic and geopolitical variables.
Macroeconomic Framework and Liquidity Flows
Bitcoin’s price action is unfolding within a complex macroeconomic environment, shaped by opposing forces that simultaneously cap upward momentum while reinforcing key technical support levels.
Monetary Policy and Bond Yields
The U.S. Federal Reserve’s monetary policy continues to exert pressure on growth assets. Although interest rates remain stable at around 3.75%, the prospect of a prolonged restrictive stance (higher-for-longer) constrains overall market liquidity. This pressure is compounded by 10-year U.S. Treasury yields holding above the critical threshold of 4.5%, diverting a significant share of institutional capital away from crypto markets.
Bitcoin Spot ETFs and Investor Sentiment
Institutional investment vehicles — particularly Bitcoin Spot ETFs — are undergoing a notable contraction phase, with cumulative net outflows of $2.26 billion over two weeks. Massive redemptions from BlackRock’s IBIT fund coincide with a negative drift in the Coinbase Premium Index, signaling a momentary decline in U.S. spot demand.
This institutional disengagement is accompanied by retail capitulation: the total number of Bitcoin-holding addresses posted its sharpest contraction in two years. Currently, only 61% of circulating supply wallets are in profit, meaning most buyers who acquired BTC above $80,000 are sitting on significant unrealized losses.
Geopolitical Factors and Risk Stabilization
In the short term, price structure has been heavily influenced by Middle East geopolitical tensions. The recent sell-off toward the $74,500 support was triggered by fears of military escalation. The announcement of substantial progress in U.S.-Iran peace negotiations — and the prospect of reopening the Strait of Hormuz — restored risk appetite and allowed Bitcoin to bounce aggressively back toward the $77,000 pivot zone.
The U.S. Strategic Bitcoin Reserve: A Structural Catalyst
Despite short-term volatility, Bitcoin’s fundamental infrastructure continues to consolidate. The presidential executive order of March 6, 2025 establishing the U.S. Strategic Bitcoin Reserve and Digital Asset Stockpile is fundamentally reshaping how sovereign states perceive the asset. Federal agencies are studying the centralization of their seized holdings — estimated at approximately 328,372 BTC — under a single public custodian, with an explicit ban on open-market sales.
Furthermore, the BITCOIN Act — which envisions the progressive acquisition of 1 million BTC over five years — acts as a major structural bullish catalyst. This sovereign reserve strategy is encouraging other nations and major corporations to integrate Bitcoin into their balance sheets as a hedge against fiat currency debasement.
Liquidity Mapping: Order Book Heatmap Analysis
The Binance order book heatmap reveals an asymmetric concentration of limit orders, defining precise price corridors for market makers and establishing the key zones where significant price reactions are expected.
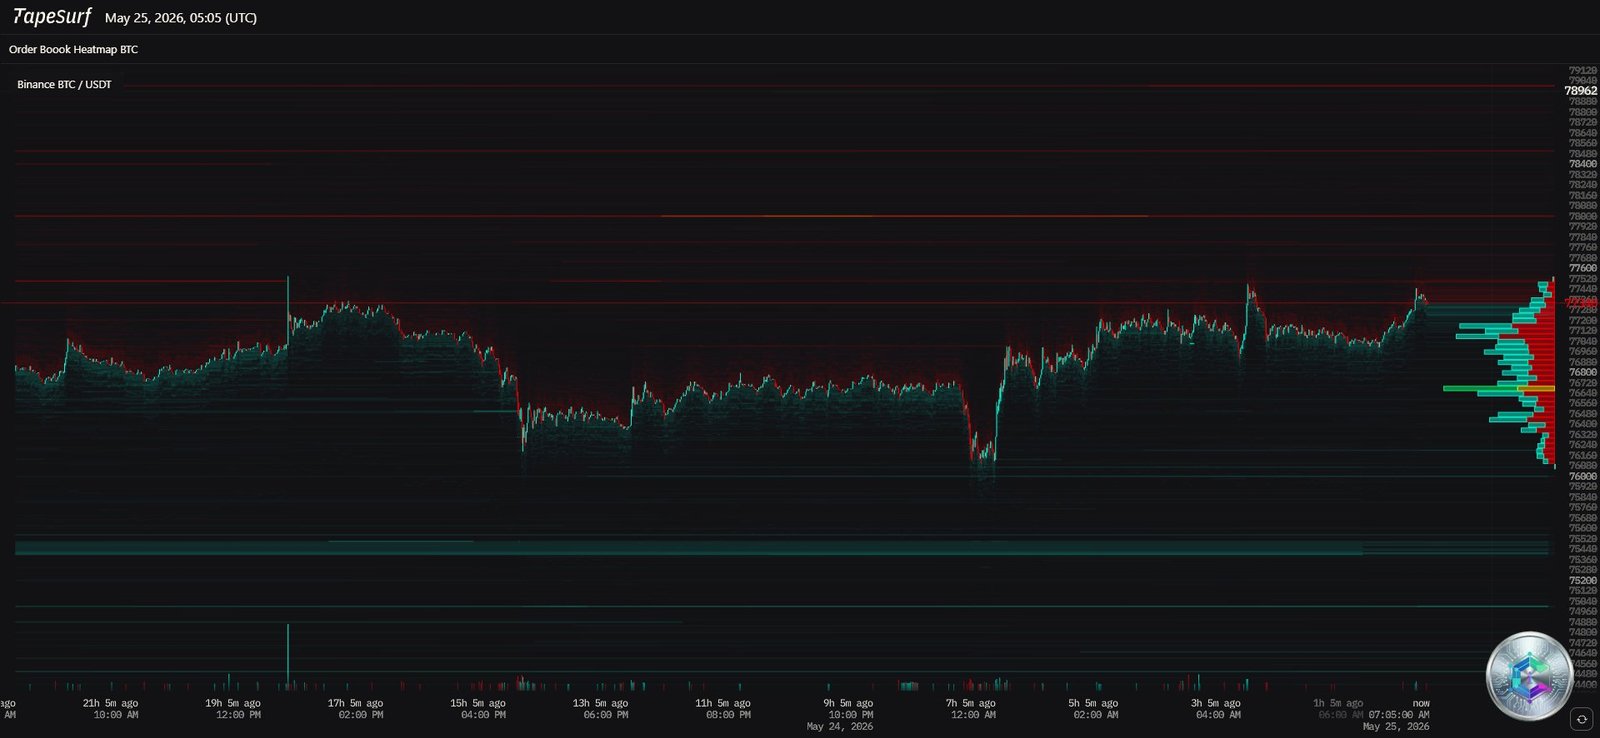
| Price Zone ($) | Order Type | Technical Role |
|---|---|---|
| $84,000 – $85,500 | Sell Orders (Asks) | Secondary bullish extension target |
| $80,000 | Massive Sell Wall (Asks) | Major psychological resistance — potential short squeeze trigger zone |
| $78,800 | Moderate Sell Orders (Asks) | Intermediate resistance — coincides with 4H 50-period MA |
| $77,000 – $77,200 | Intraday Balance | Current short-term liquidity anchor |
| $75,000 | Concentrated Buy Orders (Bids) | Key psychological support — medium-term structural pivot |
| $73,000 | Major Buy Orders (Bids) | Institutional accumulation zone (whale activity) |
| $70,000 | Institutional Bids | Long-term safety floor — residual liquidity basin |
The market faces significant latent supply pressure, driven by a net inflow of 18,528 BTC onto centralized exchanges — reinforcing the urgency for buyers to defend the $75,000 support firmly to prevent a liquidation cascade.
Multi-Timeframe Technical Analysis
Daily Chart (1D): Channel Breakout and Healthy Consolidation
The daily chart describes a major transition phase. Bitcoin successfully broke out to the upside from a broad multi-month descending channel that had contained its correction from the all-time high of $126,184 down to the $60,061 low in February 2026. Price is now consolidating around $77,000, digesting the channel breakout in a healthy accumulation pattern.
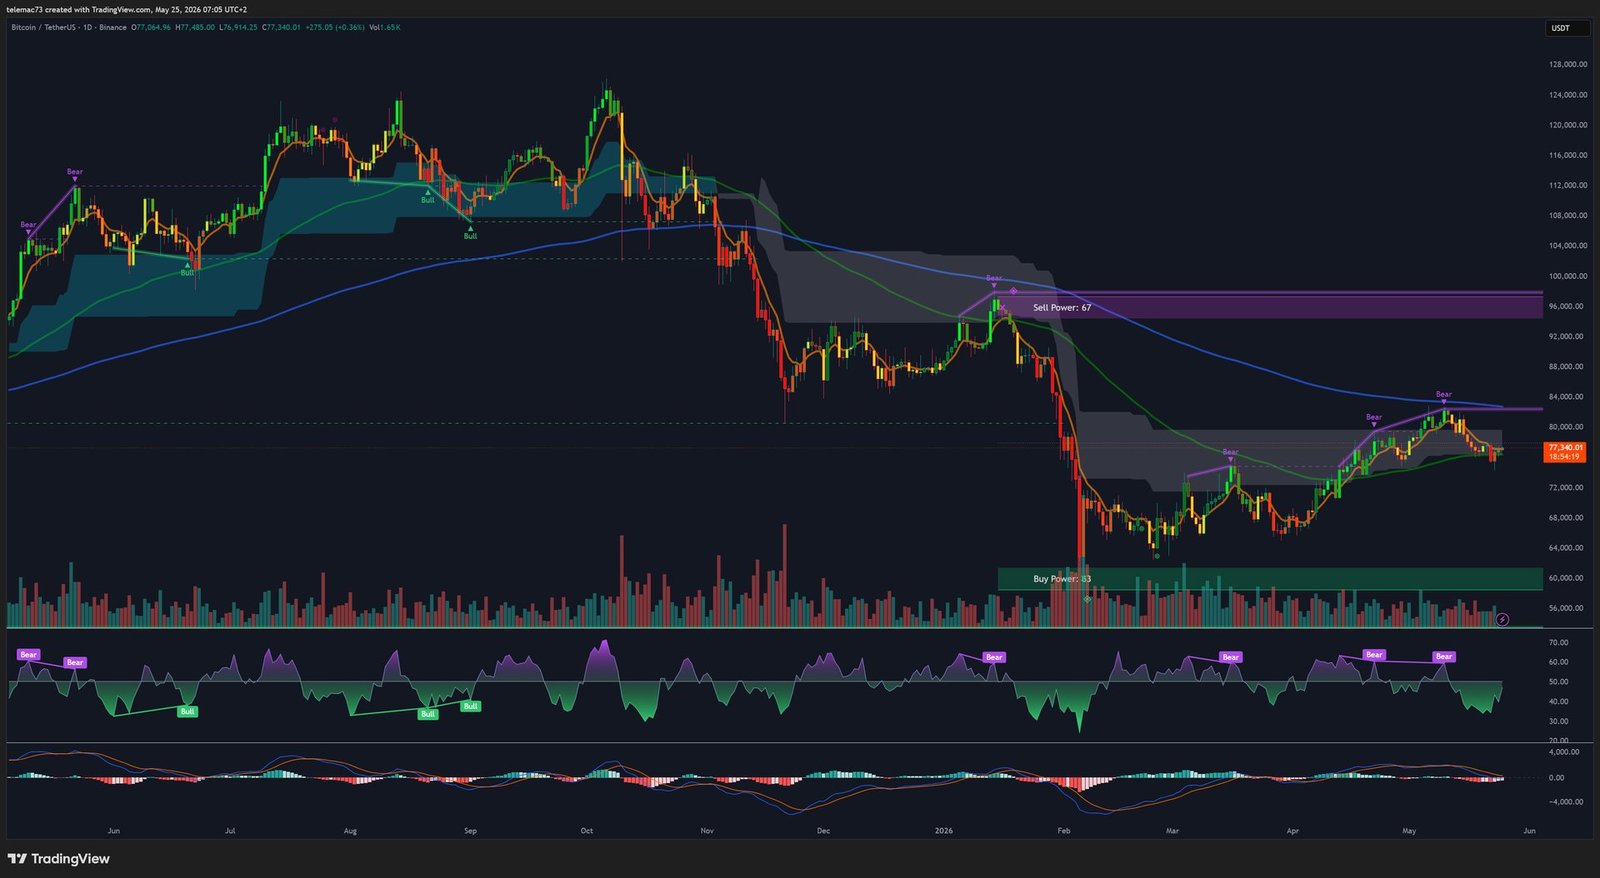
- Moving Averages (MAs): The 100-day simple moving average sits at $72,352, having completed its transition from dynamic resistance to a major macro support level, validating the underlying trend change. Confirmation of a daily Golden Cross would signal the start of a new bullish leg targeting $84,000.
- Daily RSI: Stabilized at 50%, reflecting a perfect temporary equilibrium between buyers and sellers — neither overbought nor oversold.
- Daily MACD: Signal lines are converging near the zero line, indicating a deceleration of buying momentum in favor of healthy accumulation ahead of the next impulse.
4-Hour Chart (4H): Double Bottom and Bullish Divergences
The 4H chart reveals a local corrective structure following the rejection below $82,000. Bitcoin temporarily invalidated its ascending channel before staging an orderly pullback and constructing a solid reversal base.
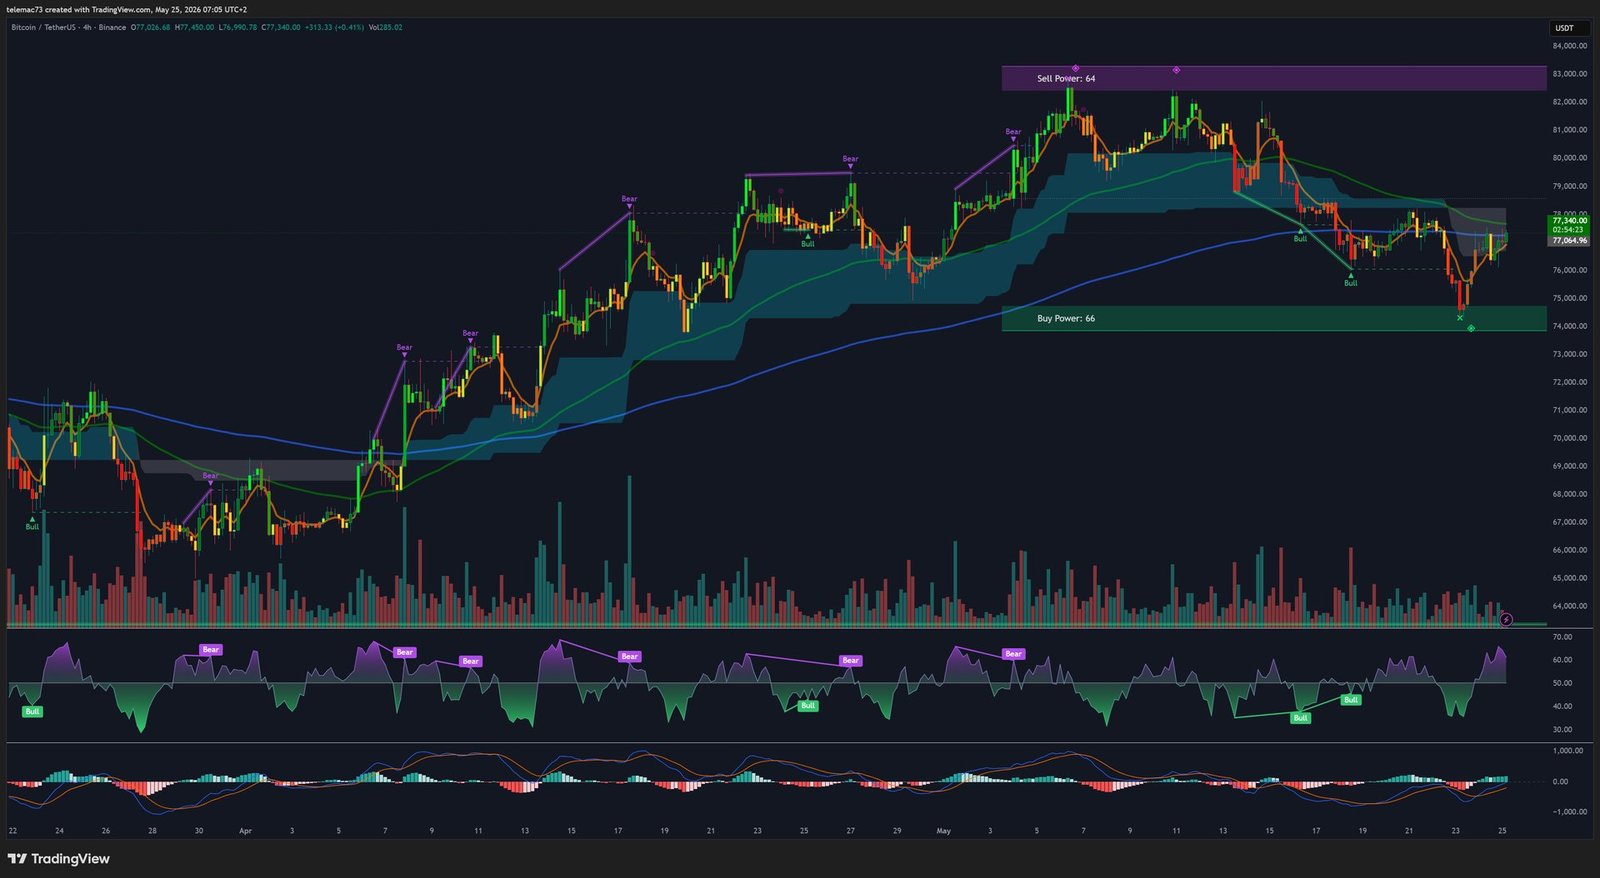
- Double Bottom (Adam & Eve): Bitcoin found solid support at $74,500, carving out a bullish reversal pattern confirmed by the reclaim of the 4H 200-period MA at $77,000.
- 4H RSI Divergence: Classic bullish divergence formed on the second low at $74,500, confirming exhaustion of selling pressure while price retested lower levels.
- 4H MACD: A clean bullish crossover below the zero line, initiated on May 24 — a strong signal confirming the return of short-term buying momentum and conditions favorable to a bullish recovery.
15-Minute Chart (15M): Compression and Explosive V-Bottom
At the intraday scale, price action highlights the speed and ferocity of the trend reversal triggered by the easing of geopolitical risks.
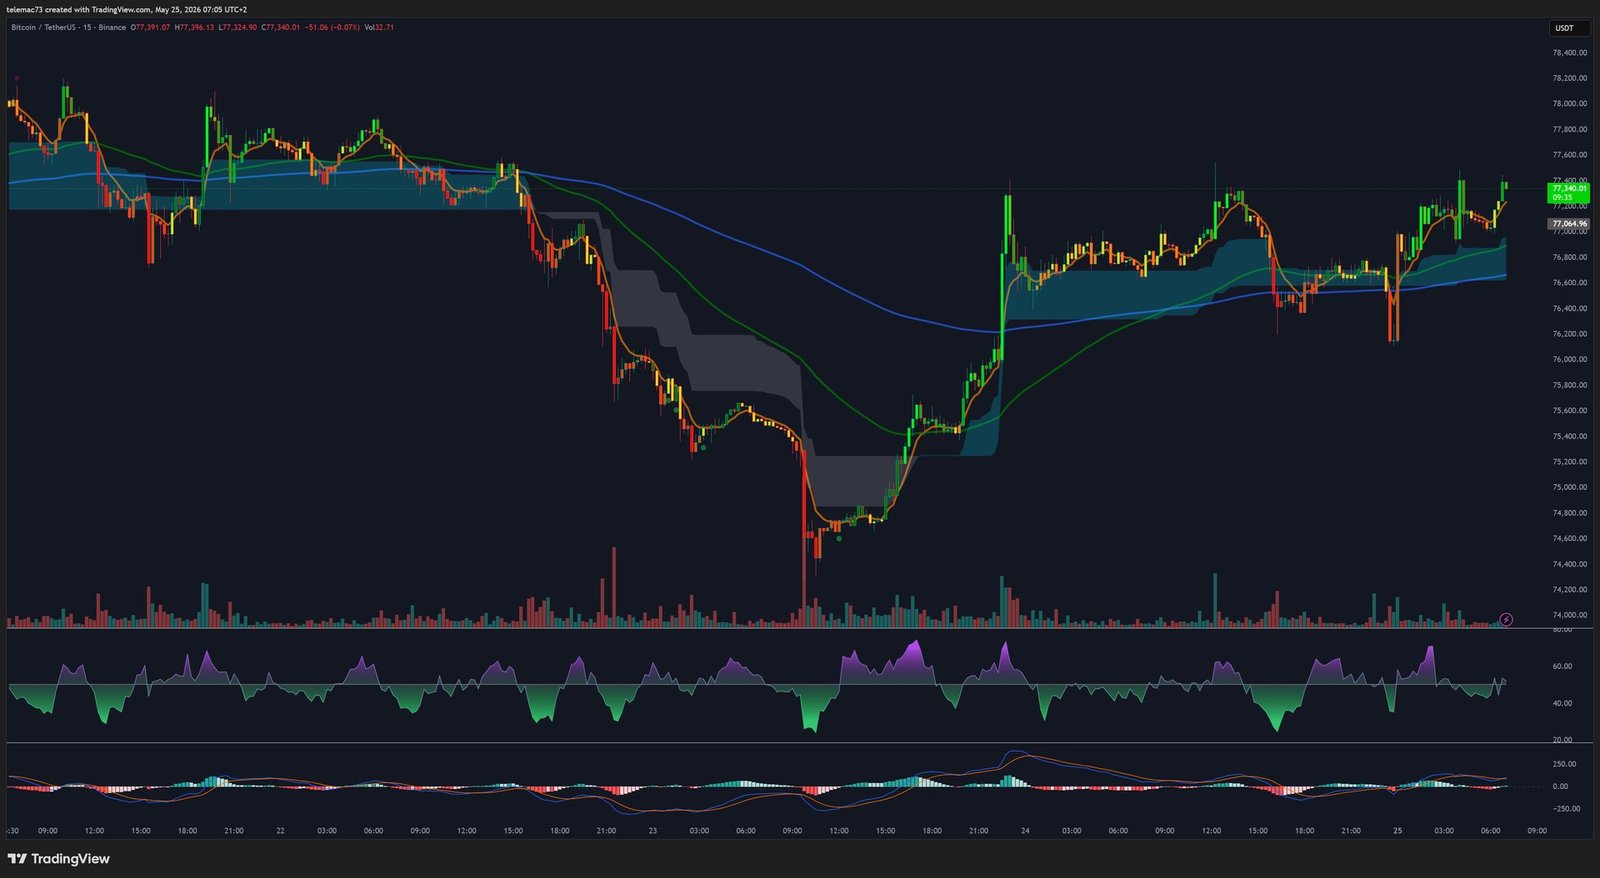
- V-Bottom: An explosive V-shaped recovery from the $74,500 lows, driven by high-volume buying candles as price reclaimed $76,000.
- Symmetrical Triangle: Since the rebound, price has settled into a compression structure bounded by a descending resistance trendline at $77,200 and a horizontal support at $76,500 — a major directional breakout is building.
- 15M RSI: Extreme oversold readings below 25 at the intraday capitulation low — a highly predictive buy signal. Currently oscillating around 55, confirming indecision within the triangle as energy builds.
- 15M MACD: Hovering near its zero line, confirming technical compression ahead of the next decisive directional breakout.
Pivot Point Levels and Volatility Modeling
Algorithmic reversal points have been modeled based on recent closing prices and statistical market standard deviations to guide short and medium-term positioning:
| Pivot Level | Price ($) |
|---|---|
| Extreme Resistance (R3) | $79,565 |
| Intermediate Resistance (R2) | $78,699 |
| Immediate Resistance (R1) | $77,289 |
| Central Pivot (P) | $76,423 |
| Immediate Support (S1) | $75,013 |
| Intermediate Support (S2) | $74,147 |
| Extreme Support (S3) | $72,738 |
Predictive Scenarios and Execution Framework
🟢 Bullish Scenario: Short Squeeze and Breakout Toward $80,000+
This scenario hinges on the preservation of the triangle’s horizontal support at $76,500 and confirmation of the 4H MACD bullish crossover. Buyers must force a breakout from the compression triangle by clearing the descending intraday resistance trendline at $77,200–$77,500.
Once recaptured, price should swiftly rally toward the 4H 50-period MA at $78,800. A confirmed close above this level would open the door to a direct assault on the $80,000 liquidity wall. Given the massive short position accumulation in that zone, a breakout above $80,000 is likely to trigger a significant short squeeze, propelling Bitcoin toward extension targets between $84,000 and $85,500.
🔴 Bearish Scenario: Rejection and Retest of Major Support
This alternative scenario envisions a failure by buyers to escape the compression zone under sustained pressure from Spot ETF capital outflows. A rejection below the $77,200–$77,500 resistance zone would break the triangle’s lower boundary at $76,500, pushing price toward the short-term psychological support at $76,000.
A loss of this level would invalidate the double bottom reversal pattern and trigger a rapid test of the long-term pivot at $75,000. Should this buyer defense fail on a daily close, the decline would extend toward the institutional whale accumulation zone between $74,000 and $74,500. At the macro level, the broader bullish trend established by the channel breakout remains intact as long as the 100-day MA at $72,352 holds on a closing basis.
⚠️ Disclaimer: This article is intended for educational and informational purposes only. It does not constitute investment advice or a recommendation to buy or sell any financial asset. Cryptocurrency markets are highly volatile and carry significant risk of capital loss. Past performance is not indicative of future results. Please consult a qualified financial advisor before making any investment decision.

