
In May 2026, Bitcoin no longer moves according to the internal laws of its own market. It has become the most sensitive adjustment variable in global finance, simultaneously crystallizing geopolitical tensions between Washington and Tehran, regulatory battles within the SEC and the U.S. Senate, and the decade’s most aggressive corporate financial engineering experiments. This exhaustive multi-timeframe technical and fundamental analysis — daily (D1), 4-hour (H4), and 15-minute (M15) charts, complemented by a liquidity heatmap — provides a deep radiograph of the microstructure of a market at a critical crossroads, as of May 24, 2026.
1. Geopolitics and Risk Premium: The Washington-Tehran Axis as a Volatility Engine
The macroeconomic environment of May 2026 has imposed a spectacular regime change on global capital markets, redefining Bitcoin’s historical correlations. Once perceived as an asymmetric hedge against monetary expansion, BTC has behaved this month as a hyper-sensitive barometer of geopolitical risk premium and global institutional liquidity.
The most influential exogenous variable has been the volatility of diplomatic negotiations between the United States and Iran. The market has reacted with extreme elasticity to news flows, demonstrating that institutional trading algorithms now integrate Middle Eastern geopolitics as a primary risk vector.
The Nuclear Impasse and Market Capitulation
Markets came under severe bearish pressure when Iran categorically rejected claims that a broader nuclear deal had been reached with Washington. The central sticking point resided in the American demand that Iran dismantle its highly enriched uranium stockpile and relinquish strategic control of the Strait of Hormuz. This refusal acted as an immediate liquidation catalyst on risk assets, dragging Bitcoin below the critical threshold of $75,000 and liquidating hundreds of millions of dollars in leveraged positions.
The Short Squeeze and Spectacular Rebound
However, Donald Trump’s public declarations claiming a bilateral deal was « essentially finalized » triggered a total reversal of microstructure. Opening the Strait of Hormuz would reduce pressure on energy inflation and increase the probability of Fed rate cuts — a scenario intrinsically bullish for Bitcoin. Despite immediate denials from Iran’s Fars news agency, the market impact was instantaneous: gold surged $30 toward $4,502/oz, and Bitcoin experienced a rare, violent short squeeze, momentarily propelling prices toward $79,000 and vaporizing tens of millions in short positions.
Decentralized prediction markets (Polymarket) recorded $57.3 million in combined volume over 24 hours on conflict-related markets, with an implicit 87.5% probability of peaceful resolution by end of 2026 — largely explaining the collapse in implied volatility on BTC options.
2. Multi-Timeframe Chart Analysis: A Radiograph of Market Microstructure
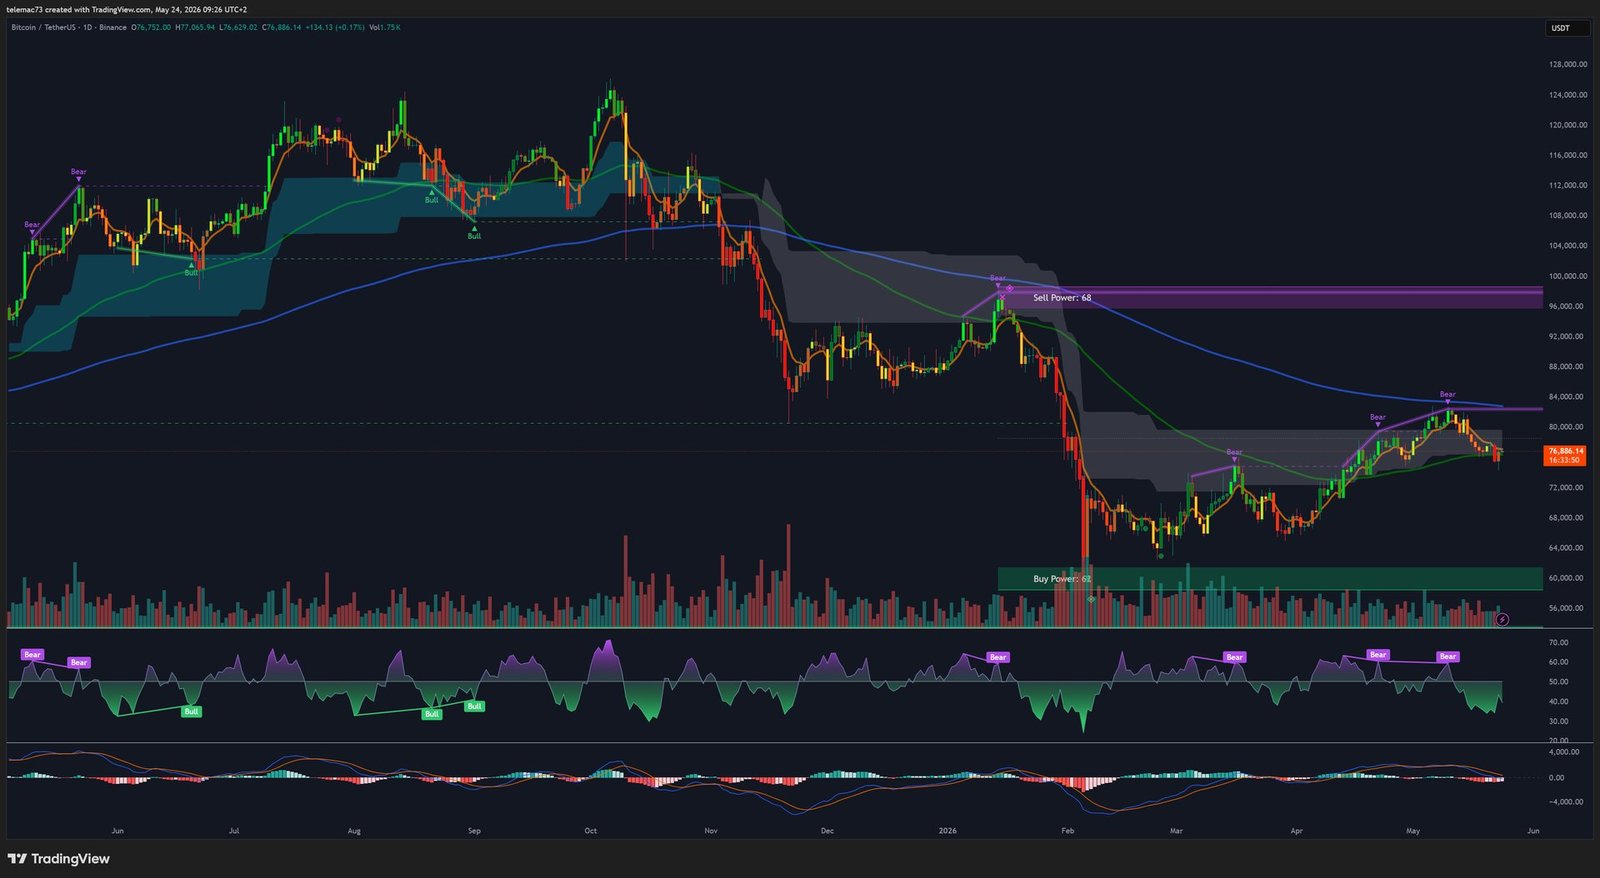
2.1 Daily Structure (D1): Fragile Stabilization After Capitulation
The daily chart reveals the full scope of the recent macroeconomic cycle. From the historical peak near $124,000, Bitcoin underwent a severe capitulation marked by successive death crosses between major moving averages, driving the asset toward a macro floor around $60,000 — where a Buy Power: 68 signal marked the inflection point of institutional demand.
From that floor, the recovery toward the current consolidation zone ($76,000 – $77,000) remains laborious. The dynamic is fragile: during the third week of May, Bitcoin temporarily lost its 20-day and 200-day moving averages. The daily RSI plunged below 28 — a statistically rare event denoting extreme oversold conditions — before initiating a recovery divergence toward the neutral 40–50 zone. The daily MACD remains in negative territory but shows a flattening histogram, signaling a loss of bearish momentum. The 200-period EMA at ~$77,700 is today’s critical demarcation line that buyers are struggling to convincingly break above.
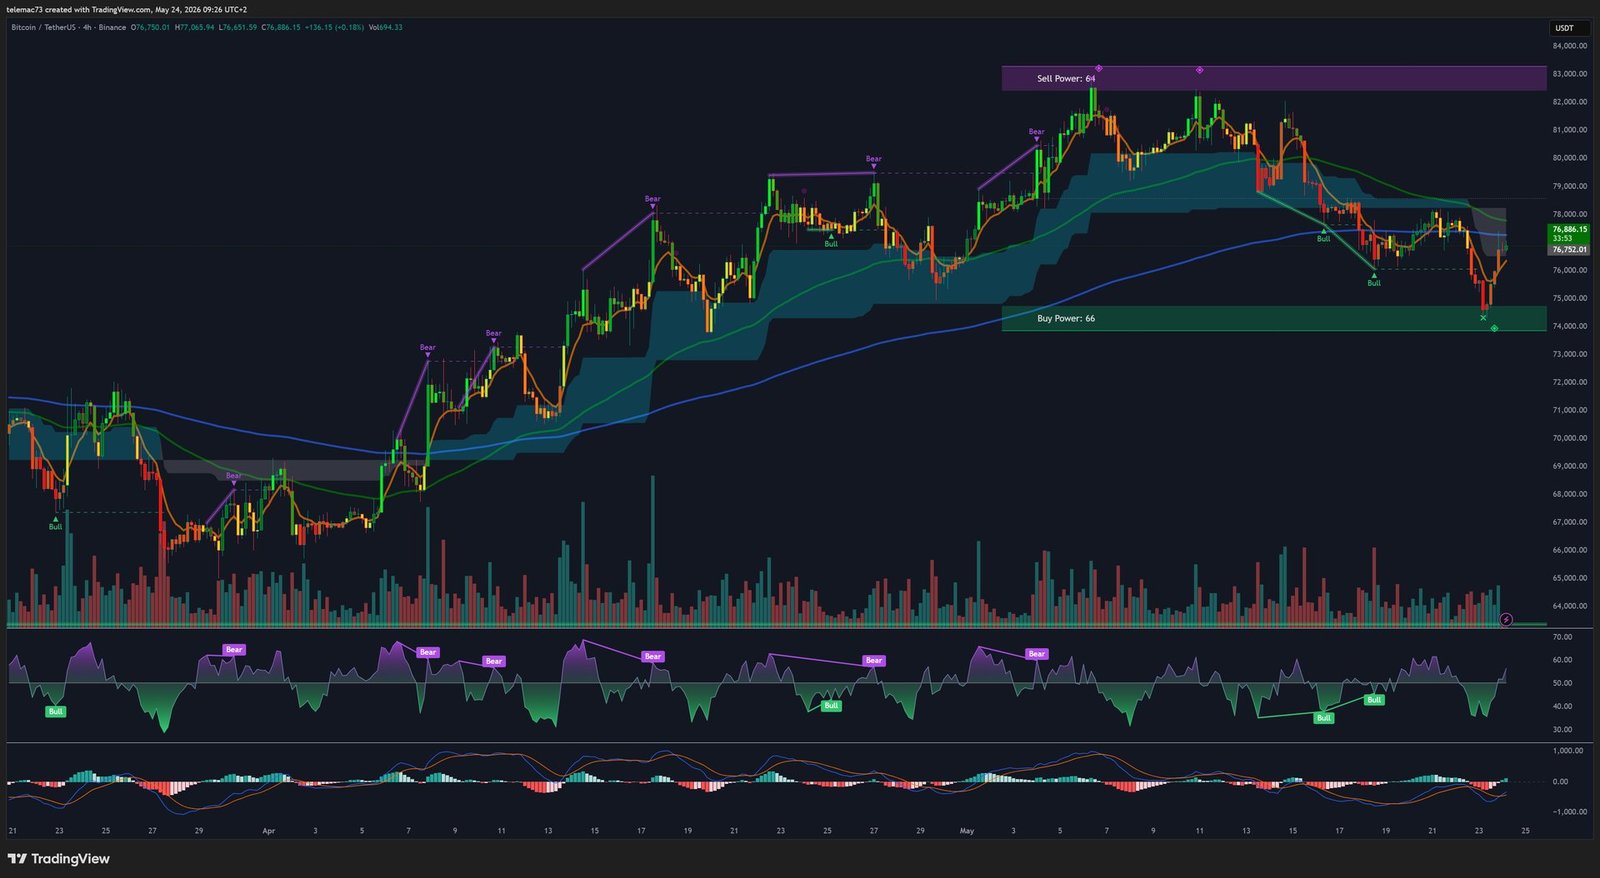
2.2 4-Hour Compression Triangle (H4): The Coil Before the Explosion
Zooming into the H4 chart, a classic geometric compression pattern emerges: a symmetrical contracting triangle. This configuration illustrates the precarious balance between supply and demand, characterized by a marked contraction in volatility and palpable directional indecision.
The upper boundary is formed by descending highs from the major resistance zone of $80,000 – $82,000 (Sell Power: 68 signal). The lower boundary is built on ascending lows from the $74,000 floor (Buy Power: 66 signal). H4 moving averages are converging and flattening, the MACD oscillates around zero producing successive whipsaws, and the RSI navigates between 40 and 60 without excess — perfect neutrality. The resolution of this compression, confirmed by volume, will dictate the asset’s next macro move.
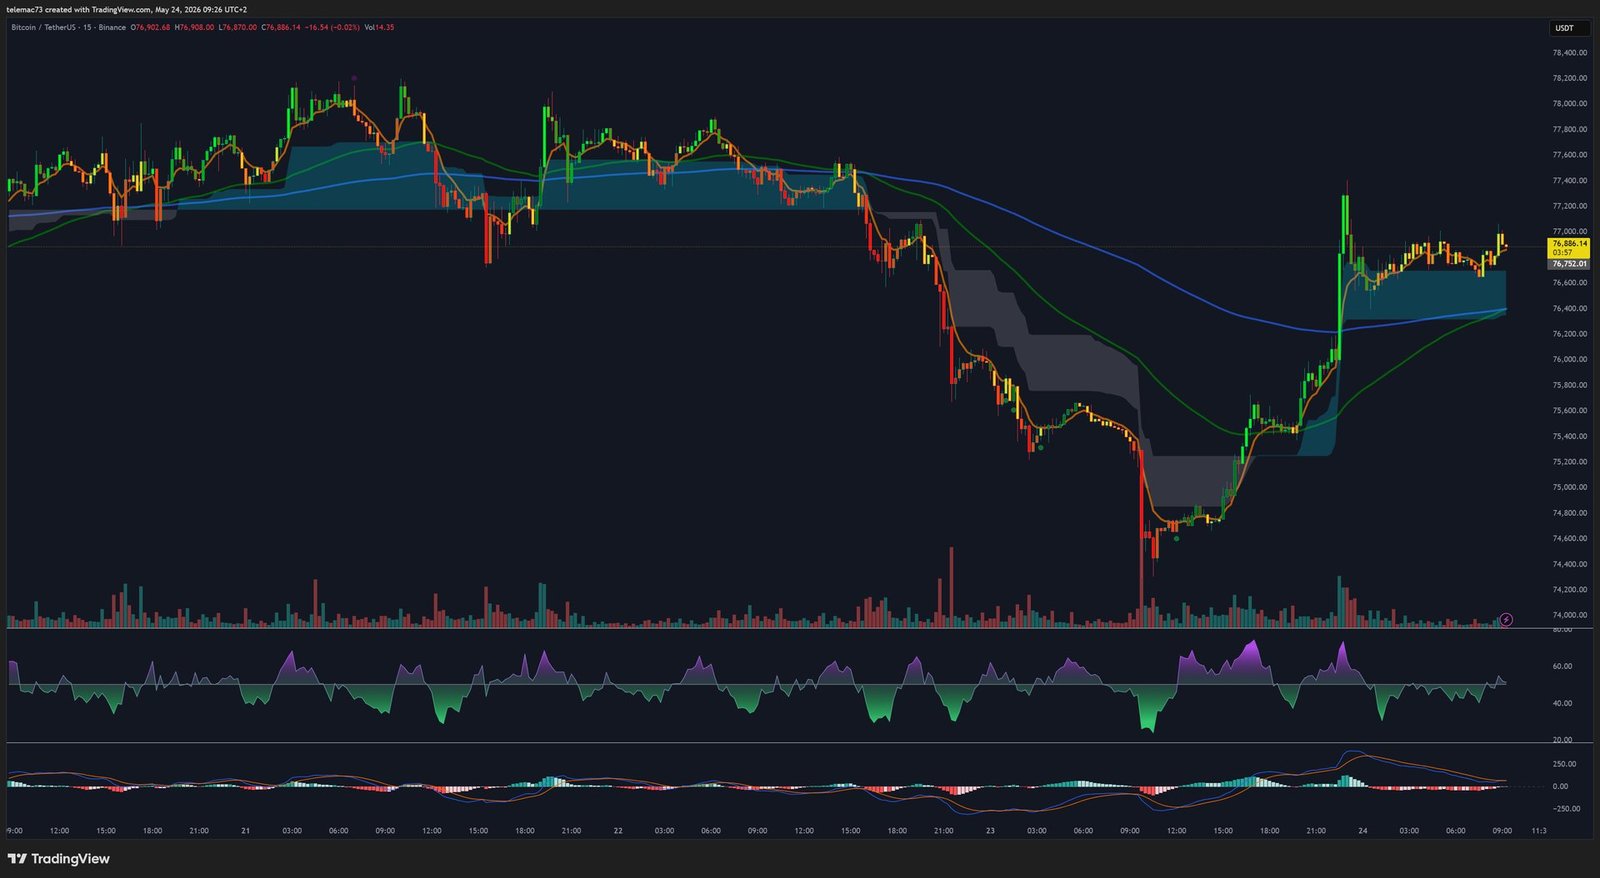
2.3 M15 Microstructure: Algorithmic Trading Fingerprints
The 15-minute chart offers a real-time X-ray of market reactions to geopolitical and regulatory news flows, revealing the fingerprints of algorithmic and high-frequency trading. Price action is dominated by a « V-shaped » recovery of the violence characteristic of institutional short squeezes.
The sequence unfolds as follows: a structured breakdown from $77,600, catalyzed by SEC announcements and Iranian tensions, materializes as a series of bear flags — brief consolidations immediately followed by impulsive bearish breakouts, evidencing systematic algorithmic distribution down to the $74,000 absorption zone. At the trough, a massive bullish engulfing candle initiates the « V »‘s ascending branch. The M15 MACD provides masterful confirmation: at the exact capitulation point, a clean and decisive golden cross with a strongly expanding positive histogram authenticates the reversal and the initiation of the short squeeze.
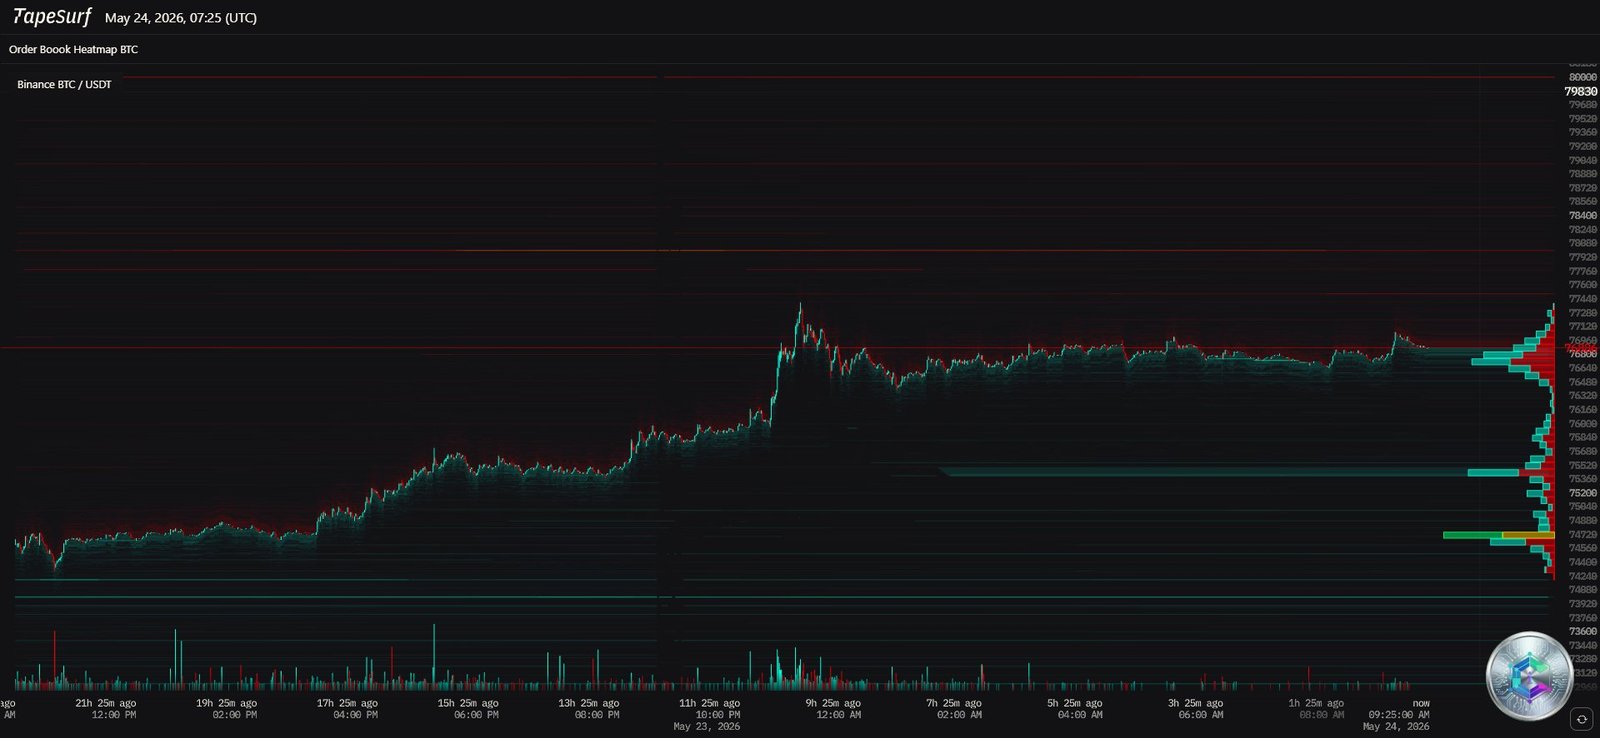
2.4 Heatmap and Liquidity Topography
The TapeSurf heatmap analysis (centered around $76,800) reveals major structural imbalances acting as magnetic forces on price. The upper hemisphere is dominated by sell walls (Ask liquidity) densely packed between $78,000 and $80,000, extending up to $82,000 — a colossal amount of capital required to absorb this supply, explaining the systematic rejections above $77,900.
Conversely, the lower hemisphere displays buy walls (Bid liquidity) solidly anchored around $75,000 and $74,500, corresponding precisely to the technical bounce zones observed on the M15 and H4 charts. This liquidity topography confirms that the market is currently bracketed by market makers who exploit consolidation within this high-friction corridor.
2.5 Key Market Levels
| Level Type | Price Zone (USD) | Technical Implication |
|---|---|---|
| Macro Resistance | $80,000 – $82,000 | Maximum sell-order density. Breakthrough requires a fundamental macro regime change. |
| Breakout Zone | $77,900 – $78,500 | Upper boundary of H4 triangle. Daily close above invalidates the local bearish structure. |
| Pivot (Fair Value) | $76,700 – $77,500 | Current equilibrium zone. Daily 200 EMA convergence. |
| Major Support | $76,000 – $76,500 | H4 triangle lower boundary. H4 close below signals seller victory. |
| Ultimate Support | $74,500 – $75,000 | Major heatmap buy walls. Capitulation zone where daily RSI hit sub-28. |
3. Fundamental Dynamics: The Asymmetry of Institutional Flows
3.1 The Bitcoin Spot ETF Hemorrhage
The U.S. Bitcoin spot ETF market is enduring a period of severe turbulence. Faced with elevated Treasury yields, « sticky » inflation, and deferred Fed rate cuts, traditional institutional investors have massively deallocated positions in digital assets. Consecutive net outflows reached $648.6M, $331.1M, $290.4M, and $100.9M across individual sessions, with weekly cumulative totals ranging from $1.07 billion to $2 billion. This continuous selling pressure via the ETF primary market has methodically crushed every attempt at organic bullish momentum formation.
3.2 The MicroStrategy Paradigm: Buying Machine and Systemic Risk
Against this backdrop of passive capital flight, Bitcoin’s resilience rests almost entirely on a fundamental anomaly: MicroStrategy’s (MSTR) treasury strategy. Since early 2026, the company has acquired 171,238 BTC — approximately triple global mining production over the same period (62,000 to 63,450 BTC). 10x Research analysts estimate that MSTR’s financial engineering now represents approximately 70% of all global buying power on the Bitcoin market.
The mechanism relies on the perpetual preferred stock STRC (11.5% annual dividend): institutional demand to capture this yield pushes STRC’s price toward par value, enabling MicroStrategy to issue new shares and immediately direct proceeds toward BTC purchases. This price-inelastic buying machine protects the market from deep capitulation, but introduces a critical single point of failure risk: if the STRC mechanism seizes (credit downgrade, SEC intervention, dividend appetite collapse), the market would instantly lose 70% of its primary demand driver.
4. Regulation: The SEC Brakes as the Senate Legislates
The most impactful regulatory event of May 2026 was the SEC’s postponement of its « innovation exemption framework. » This eagerly anticipated program was designed to authorize the issuance and trading of tokenized versions of traditional U.S. stocks on blockchain. With the Real World Asset (RWA) sector having already surpassed $34 billion in capitalization, the delay was perceived as a major setback — largely catalyzing Bitcoin’s fall below $75,000.
Paradoxically, the U.S. legislature is advancing the Digital Asset Market Clarity Act, which tackles the taxonomy of digital assets by legally defining the « network token » (a digital commodity excluded from securities classification) and the « ancillary asset » (whose value depends on third-party managerial effort). Separately, the OCC has published guidelines actively favoring partnerships between commercial banks and stablecoin issuers. These advances offer an institutional glimmer of hope for blockchain’s integration into traditional finance.
5. Derivatives Markets and the Volatility Paradox
Global leverage posted a spectacular 19.7% increase over the month, making the derivatives structure highly combustible. During the slide below $75,000, more than $500 million in futures positions were force-liquidated in a single session, including over $200M of BTC long positions. During the inverse short squeeze, $123.95M in short positions were vaporized against only $43.16M in longs, affecting more than 144,400 traders — including a singular Binance liquidation order worth $9.63M.
The most striking paradox remains the behavior of implied volatility (BVIV): despite the violence of spot market swings, the index fell to 38%, its lowest level since October 2025. This volatility compression — fed by MicroStrategy’s inelastic buying, systematic options selling by institutions, and anticipated geopolitical de-escalation — suggests that major operators are positioning for a period of relative stagnation or slow appreciation.
6. Altcoin Ecosystem: Capital Rotation and the XRP Anomaly
The most revealing sign of institutional caution is the collapse of the ETH/BTC ratio to its 2026 year-low (~0.027), illustrating a classic flight to quality within the digital asset class itself. Faced with macro uncertainty, capital is abandoning layers of infrastructure perceived as riskier to seek refuge in Bitcoin’s superior liquidity. ETH investor sentiment has hit a historical low, with the asset struggling to defend $2,200 and risking a test of the $2,000 psychological support.
In this devastated landscape, two bullish anomalies stand out. Hyperliquid (HYPE) posted weekly gains of 31% to 47%, illustrating an isolated hyper-speculative rotation. More structurally, XRP displays resilience defying classical correlation models: while Bitcoin suffered massive ETF outflows, XRP ETF products captured more than $42 million in net inflows over consecutive days, corroborated by the creation of 4,300 new wallets in 24 hours — a potential leading indicator, according to Santiment.
7. Synthesis and Forecasting Scenarios for End of Q2 2026
The integration of all these vectors — rigorous chart analysis (D1, H4, M15), liquidity modeling (Heatmap), divergent institutional flows, and geopolitical and regulatory framing — allows for a probabilistic modeling of Bitcoin’s trajectory through the end of the second quarter of 2026.
The asset is currently trapped within a geometric compression structure (H4 triangle) with boundaries spanning from $76,000 to $78,500. The daily RSI recovering from a historic oversold trough (sub-28) signals a fundamental bias toward absorption, while the crushing of implied volatility (BVIV at 38%) announces that a massive directional expansion move is imminent.
🟢 Bullish Scenario (Breakout)
A clean, volume-confirmed breakout above $77,900 – $78,500 would trigger short sellers’ stops and initiate a liquidity hunt beyond $78,500. The cascading effect of short liquidations would mechanically propel prices toward the macro-structural target of $80,000 – $82,000. This scenario requires favorable macroeconomic alignment: official confirmation of the Hormuz Strait agreement and a slowdown or reversal of massive ETF redemptions.
🔴 Bearish Scenario (Breakdown)
A confirmed H4 or daily close below the critical institutional support of $76,000 would signal the inability of demand to offset continuous ETF outflows. In this scenario, a violent test of the ultimate oversold zone between $74,500 and $75,000 would follow, where remaining buy walls would attempt to stem a deeper capitulation.
⚠️ Disclaimer: This article is published for educational and informational purposes only. It does not constitute investment advice, a recommendation to buy or sell, or a financial solicitation of any kind. Cryptocurrency markets are highly volatile and carry a risk of capital loss. Consult a qualified financial advisor before making any investment decisions. CryptoInfo.ch disclaims any responsibility for decisions made based on this content.