
Bitcoin finds itself at a critical inflection point on Sunday, April 12, 2026 — caught between unprecedented institutional maturity and a geopolitical volatility that is reshaping traditional correlations across risk assets. Trading around $71,482, the asset posts a modest 1.89% decline over the past 24 hours. Yet this surface-level stability conceals unusually powerful undercurrents.
The Fear & Greed Index has collapsed to 16 — « Extreme Fear » territory not seen since the systemic crises of 2022 or the COVID crash. This divergence between price action and retail sentiment strongly suggests we are entering a massive liquidity transfer phase: from speculative hands into institutional vaults.
Macro Environment and Systemic Correlations
Analyzing Bitcoin in 2026 can no longer ignore real-economy indicators — its integration into managed portfolios is now too deep. The current landscape is dominated by U.S. inflation and global energy tensions. Bureau of Labor Statistics (BLS) data for March 2026 shows CPI up 0.9% month-over-month, bringing annual inflation to 3.3% — primarily driven by an energy sector that surged 12.5% year-over-year.
Oil’s Influence and the Geopolitical Pivot
In 2026, Bitcoin has shown an 85% correlation with the Nasdaq-100, reacting with surgical precision to WTI crude oil swings. Escalating U.S.-Iran tensions around the Strait of Hormuz pushed Brent crude to Q1 highs, triggering a risk-off wave on growth assets. A two-week ceasefire announced in early April acted as a powerful relief catalyst, allowing BTC to decouple from its temporary negative correlations and reclaim key levels.
| Macro Indicator | Value (March/April 2026) | BTC Impact |
|---|---|---|
| Annual CPI | 3.3% | 🔴 Bearish (Fed pressure) |
| Core CPI (ex-energy) | 2.6% | 🟡 Neutral / Positive |
| Fed Funds Rate | 3.50% – 3.75% | 🟡 Pivot awaited |
| Brent Crude | Declining post-ceasefire | 🟢 Bullish (inverse risk correlation) |
| Fear & Greed Index | 16 (Extreme Fear) | 🟢 Contrarian — buying opportunity |
Capital Market Structure: ETFs and Whale Accumulation
2026 marks the apex of the spot Bitcoin ETF era. After a brief outflow phase in early April, institutional sentiment reversed sharply on April 9, 2026, with an estimated net inflow of +$427M into the U.S. ETF ecosystem. This recovery is led by BlackRock’s iShares Bitcoin Trust (IBIT), which recorded its largest single-day inflow in five weeks.
The arrival of the Morgan Stanley Bitcoin Trust (MSBT) — NYSE-approved in March 2026 — injected fresh liquidity from day one, proving that traditional finance demand for Bitcoin exposure remains structurally unsatisfied.
| ETF Fund | Flows (April 9) | AUM (est.) | Market Share |
|---|---|---|---|
| BlackRock IBIT | 🟢 5-week record | ~$60B | 49% |
| Fidelity FBTC | 🟢 Positive | ~$15B | 11% |
| Morgan Stanley MSBT | 🟢 +$30M (Day 1) | New | < 1% |
| Grayscale GBTC | 🔴 Net outflow | ~$14B | 10% |
| Ark 21Shares ARKB | 🔴 Net outflow | ~$3B | 2% |
A key structural shift: Bitcoin’s correlation with Binance’s Global Easing Breadth Index has moved from a weak positive (+0.21) to a strong negative (-0.778) in 2026. BTC is no longer simply following monetary expansion — it is anticipating liquidity shocks, behaving more as an early-warning system. On-chain data simultaneously confirms that whales (> 1,000 BTC wallets) are accumulating aggressively for the second consecutive week of 2026.
Technical Analysis — Daily Chart (1D)
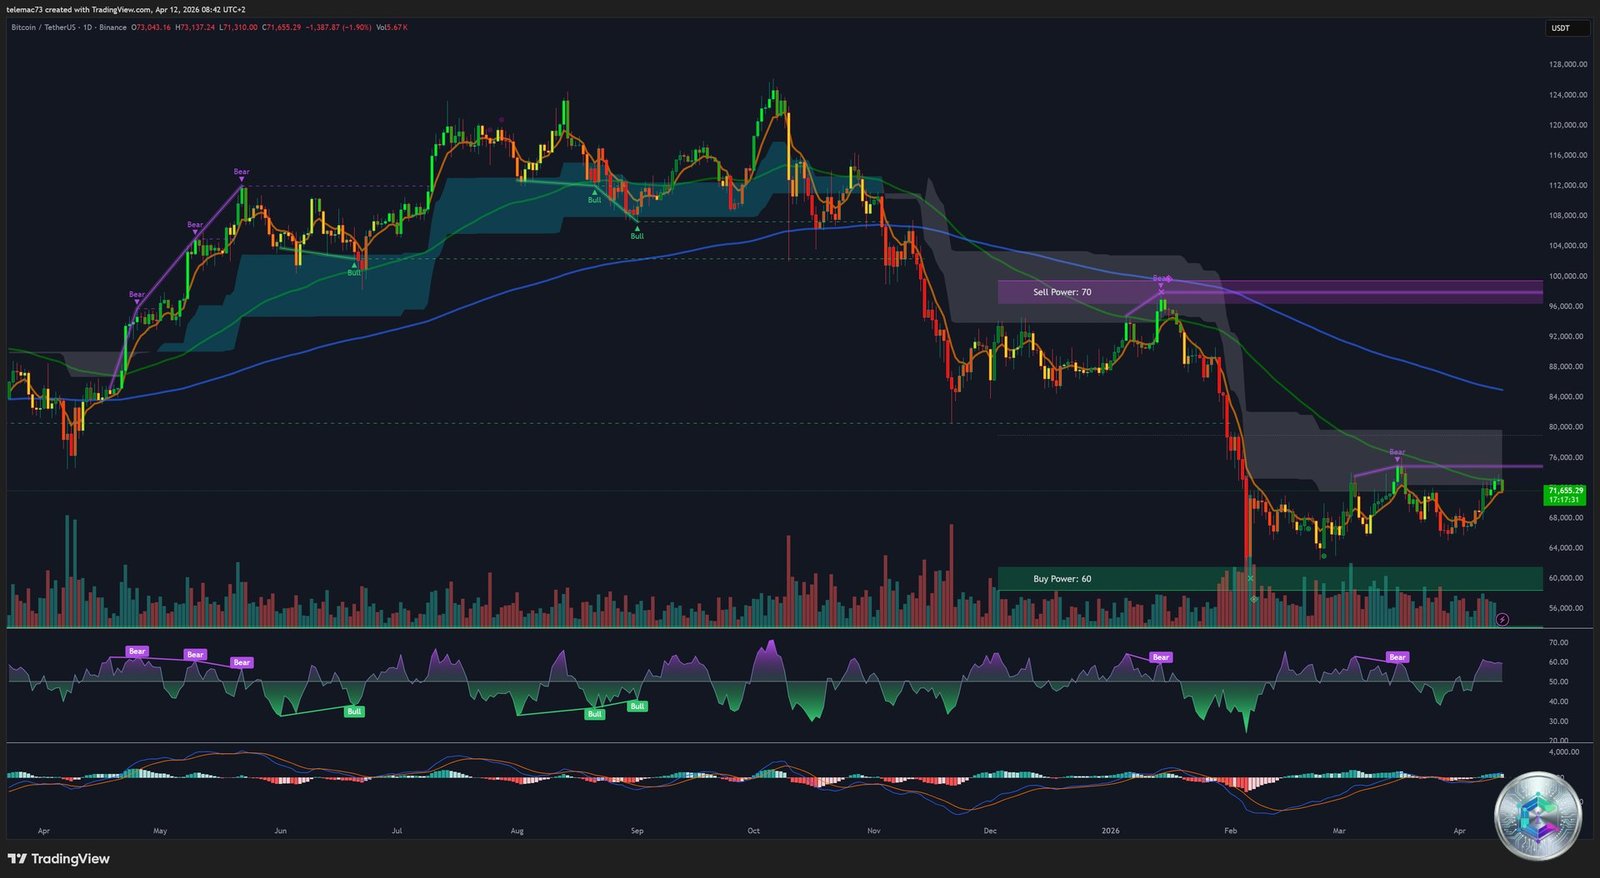
The daily chart reveals a complex price structure oscillating between a healthy correction and breakout preparation. Bitcoin has formed a Rounded Bottom pattern over recent months, signaling a progressive transition from a selling regime toward an accumulation phase.
RSI and Hidden Divergences
The daily RSI stands at 58.44 — a neutral-positive zone. However, a deeper read reveals a hidden bearish divergence: between March 4 and April 9, while price printed lower highs, the RSI formed higher highs. This suggests the recent bounce may be more fragile than it appears, and a flush of residual optimism may be needed before any sustained push above $90,000.
RSI = 100 – [100 / (1 + RS)] where RS = Average Gain / Average Loss over 14 periods. Current value: 58.44 — buyers maintain a slight edge, but overbought territory (70+) remains distant.
Moving Averages: Toward a Golden Cross?
The 200-day MA has been in persistent decline since July 2025, indicating underlying trend pressure. However, the 50-day MA is flattening and showing early signs of upward reversal. A potential Golden Cross (50 MA crossing above 200 MA) in coming weeks would constitute one of the most historically powerful secular bull market signals.
Momentum Analysis — 4-Hour Chart (4H)
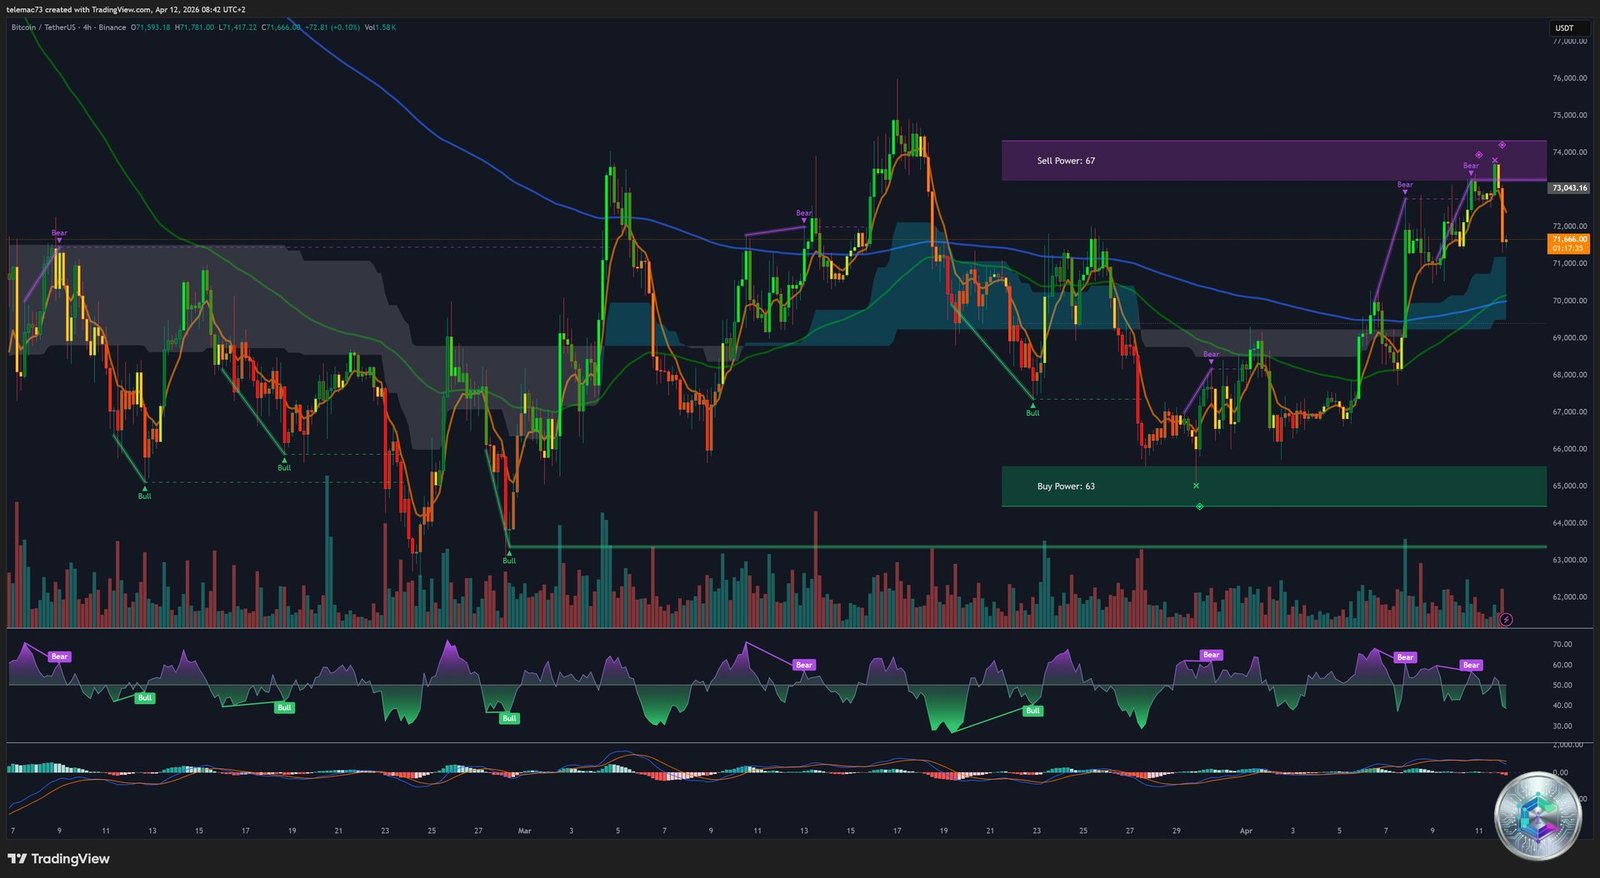
The 4H chart provides a tactical perspective on this week’s moves. Bitcoin is trading within a Buy Power zone identified between $83,000 and $84,500. Conversely, a massive Sell Power zone between $86,800 and $90,000 has acted as a glass ceiling since February 2026.
4H MACD: Bullish Signal Confirmed
The MACD (12,26,9) on the 4H timeframe shows a clearly positive dynamic: the MACD line has crossed above the signal line, and the histogram is in green territory. MACD value stands at 76, placing the asset in a technical « Buy Zone » by algorithmic standards — confirming the bounce triggered by the Iranian ceasefire announcement.
Ichimoku: Navigating the Cloud
Price is navigating within the Ichimoku cloud (Kumo). The Tenkan-Sen and Kijun-Sen are converging, signaling compression. A breakout above the cloud (~$85,000) would validate a strong buy signal. A break below ~$81,500 would invalidate the immediate breakout thesis. The 50-period EMA (~$83,200) currently serves as the last line of defense for buyers.
Intraday Microstructure — 15-Minute Chart (15M)
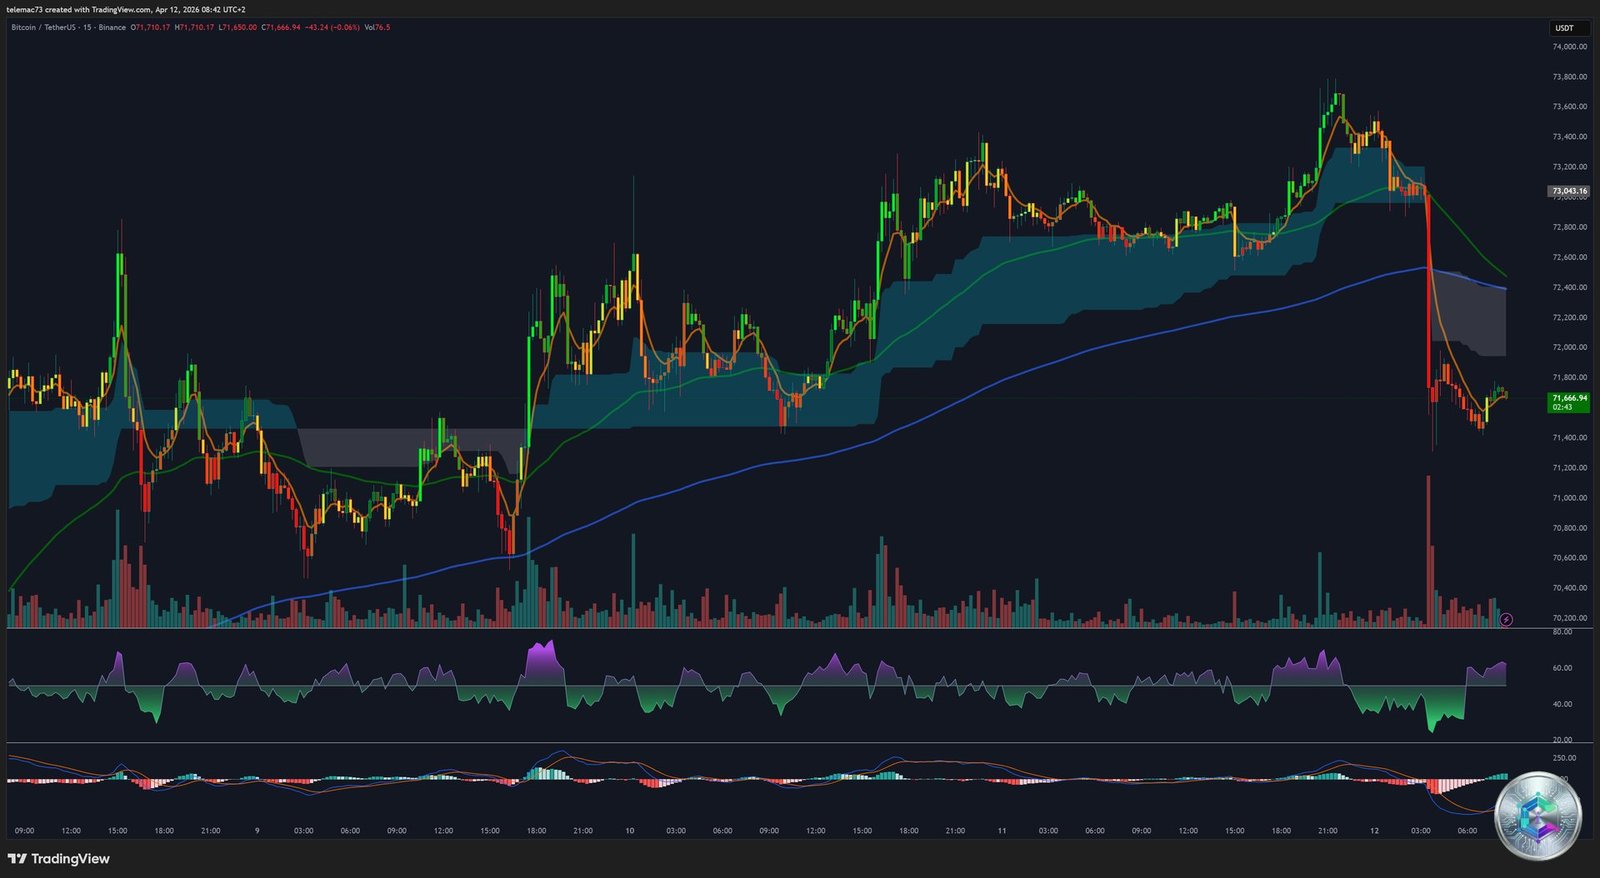
The 15-minute chart highlights the « surgical » volatility triggered by macro announcements. A sharp drop from local highs to the ~$83,500 pivot was triggered by profit-taking following the U.S. CPI release.
Bollinger Bands: The Spring Is Coiled
Bollinger Band width is at its lowest reading since early 2024. This type of compression — with Bitcoin confined to a tight range for over two months — statistically resolves with a violent directional move of approximately 40%. The market is loading its spring before an explosive volatility breakout that should define the trend for H2 2026.
CME Gaps: Residual Liquidity Below
Two significant CME gaps remain open below current price: one near ~$76,000 and a more critical one near ~$73,000. Historically, 90% of CME gaps are filled within a week of creation. The current pullback can be interpreted as a mechanical liquidity hunt to fill these imbalance zones before a healthy rally resumes.
Liquidation Heatmap and Order Book Depth
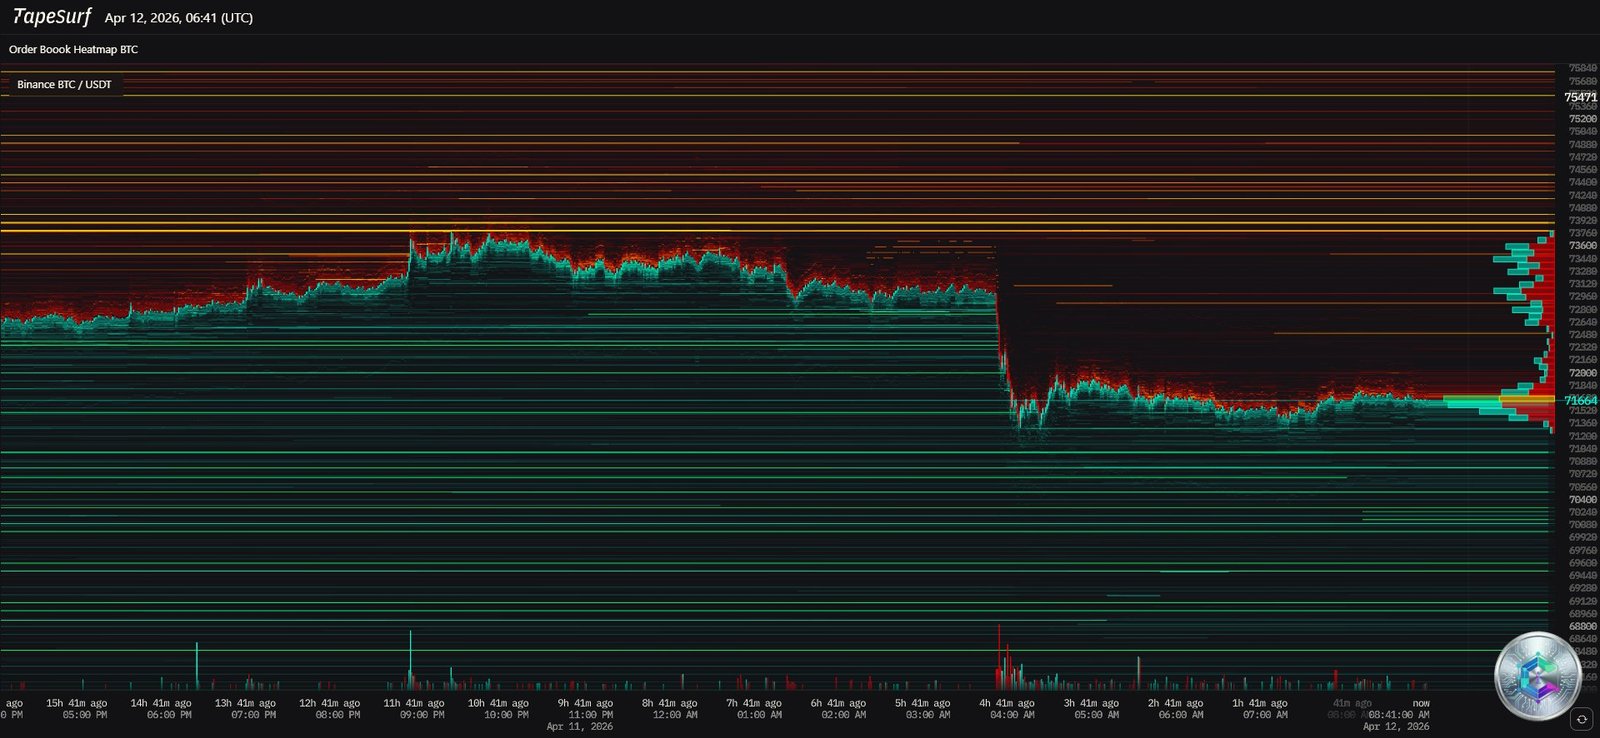
The liquidation heatmap is arguably the most revealing element of the current situation. It shows a massive concentration of highly-leveraged short positions clustered just above the current price, in the $85,000–$90,000 zone.
The Short Wall: A Bullish Magnet
An estimated $5 billion in short positions are stacked between $85,000 and $90,000. This zone acts as a price magnet. If Bitcoin breaks the $85,000 resistance with volume, a forced liquidation cascade will trigger: short sellers will be forced to buy back at market price, creating artificial buying pressure capable of propelling BTC toward $90,000+ within hours.
| Price Zone | Est. Liquidation Volume | Type | Cascade Risk |
|---|---|---|---|
| $86,800 – $90,000 | ~$3B | Shorts | 🔴 Very High |
| $85,000 – $86,800 | ~$2B | Shorts | 🟠 High |
| $81,500 – $83,200 | ~$450M | Longs | 🟡 Moderate |
| $78,000 – $79,500 | ~$2.5B | Longs | 🔴 Very High (Major Support) |
Derivatives Market: Open Interest and Funding Rates
The derivatives market shows clear signs of seller exhaustion. Open Interest hovers around $24B, slightly down from the $25B peak reached on April 8.
Funding rates have cooled significantly, dropping from 0.007% to 0.002%, and even turning negative on platforms like Binance. Negative funding means shorts are paying longs to hold positions — a rare scenario at these price levels that signals the derivatives market is technically oversold. This strongly reinforces the imminent short squeeze thesis.
The on-chain P/L transfer ratio has climbed to 2.95 — its highest reading in 12 weeks — suggesting most recent activity reflects profit-taking from earlier buyers rather than genuine capitulation. Historically, such P/L peaks precede short-term local tops, confirming the need for lateral consolidation before any resistance breach.
Chart Synthesis: Key Patterns and Scenarios
Bull Flag on 4H
The 5% rally between April 6–10 forms the flagpole, while the current lateral drift between $83,000 and $85,000 constitutes the flag. The theoretical target of this pattern, calculated by projecting the flagpole from the breakout point, points toward ~$91,000.
Symmetrical Triangle on 1D
On the daily timeframe, Bitcoin appears locked within a symmetrical compression triangle whose apex arrives at end of April. The resolution will likely coincide with the FOMC decision on April 29 — a pivotal date for directional determination.
📊 Support Levels
- ~$83,200 — 50 EMA (4H): immediate pivot
- ~$82,000 — Dynamic support (April 8 reclaim)
- ~$79,500 — Buy Power Zone
- ~$76,000 — Range floor / CME gap
📊 Resistance Levels
- ~$85,000 — Rounded Bottom neckline
- ~$86,800 — 2026 Range Ceiling
- ~$90,000 — Overhead supply (Nov. 2025)
- ~$95,000 — 200-day MA (1D): long-term target
Miners and Supply Pressure
A crucial but often overlooked factor in April 2026: miner selling pressure. Reports indicate Marathon Digital (MARA) moved 250 BTC while Riot Platforms sold 1,500 BTC in early April to cover surging energy costs. However, this selling pressure is rapidly absorbed by ETFs, which added ~50,000 BTC to their holdings in March. MicroStrategy also purchased 4,871 BTC in early April. This ongoing tug-of-war between miner supply and institutional demand is the structural engine of current volatility.
Directional Scenarios for Q2 2026
🟢 Bullish Scenario
If BTC closes a daily candle above $85,000, the rounded bottom pattern is validated. The short liquidation cascade will fuel a push toward $90,000–$95,000 by end of April. Estimated probability: 65% given the current ceasefire backdrop and record ETF inflows.
🔴 Bearish Scenario
If geopolitical tensions resume or April CPI surprises to the upside, BTC could fail at $85,000. A break below $81,500 would quickly send price to fill the CME gap at ~$76,000, potentially sliding to the range floor at ~$73,000. In a severe stagflation scenario, a return to $60,000 within six months cannot be excluded.
Conclusion
On April 12, 2026, Bitcoin no longer behaves as a speculative internet currency — it operates as a sophisticated barometer of global liquidity and geopolitical risk. The convergence of a bullish MACD, a neutral RSI with hidden divergence, and historically tight Bollinger Bands signals an imminent large-scale directional move. The presence of an estimated $5B in shorts above current price represents the most likely catalyst for an upside push.
Critical levels to watch: $85,000 resistance (breakout validation) and $81,500 support (buyer defense line). The April 29 FOMC decision will be the decisive exogenous variable.
⚠️ Disclaimer
This article is published for educational and informational purposes only. It does not constitute investment advice or a recommendation to buy or sell any asset. Cryptocurrency markets are highly volatile and past performance does not guarantee future results. Only invest what you are fully prepared to lose and consult a licensed financial advisor before making any investment decision.