
Bitcoin at the Crossroads: Complete Technical & Macroeconomic Analysis — April 7, 2026
The digital asset ecosystem is navigating a pivotal inflection point as we enter the second quarter of 2026. The global crypto market capitalization stands at an impressive $2.43 trillion, with 24-hour trading volume approaching $96.92 billion. Bitcoin maintains an overwhelming dominance of 56.62% of total market share, empirically reinforcing its status as a relative safe-haven asset amid the severe correction suffered by the vast majority of altcoins.
🌍 Macroeconomic Context: A Paradigm Shift
The global macroeconomic architecture is currently under tectonic pressure. Recent escalations in Middle East geopolitical tensions have profoundly disrupted global financial market dynamics, creating an environment of endemic uncertainty. The crisis has drastically disrupted energy supply chains — affecting approximately 20% of global oil trade — mechanically propelling Brent crude up 36% and pushing the VIX volatility index, the absolute barometer of institutional fear, to a peak of 35.
Yet a deep analysis of comparative performance within this macroeconomic chaos highlights a fundamental paradigm shift in institutional perception of Bitcoin. Over the first 32 days of the conflict, BTC recorded a modest but symbolic gain of +1% (with intraday volatility peaks of +14%), while the S&P 500 fell 8% and semiconductors crashed 12%. More strikingly, traditional safe-haven assets tragically failed their protective mandate: gold and silver plunged 13% and 22% respectively over the same period. This unprecedented structural decorrelation considerably reinforces the Bitcoin-as-supra-sovereign-asset narrative.
On the monetary policy front, the Fed’s benchmark rates remain in a restrictive range of 3.50%–3.75% following the March 18 meeting. The next critical FOMC meeting is scheduled for April 28–29, 2026 — a pivotal milestone that will dictate the directional trajectory of risk assets for the quarter ahead.
🧠 Market Psychology & Institutional Flows
The Fear & Greed Index — a composite quantitative barometer measuring implied volatility, transaction volume velocity, market momentum, and social media sentiment — has plunged to an alarming level of 11 out of 100, firmly anchoring the market in « Extreme Fear » territory. This is, according to historical records, the most severe and sustained psychological contraction since the systemic collapse of the FTX platform in late 2022. Historically, such depressive readings almost invariably precede major macro market bottoms and announce asymmetric rebounds driven by total seller exhaustion.
Despite this palpable anxiety, on-chain data and institutional investment flows reveal a diametrically opposite underlying reality: a structural accumulation orchestrated by high-capitalization entities. March 2026 marked a critical inflection point. US spot Bitcoin ETFs recorded massive net inflows of $1.2 billion, spectacularly reversing a deleterious four-month streak of net outflows. Simultaneously, corporate treasuries raised $1.56 billion via preferred stock issuance to fund direct BTC purchases on the open market.
However, this sustained institutional buying pressure is momentarily counterbalanced by distribution from a specific cohort of historical actors. Wallets holding 1,000–10,000 BTC have reversed their polarity, shifting from a net accumulation surplus of 200,000 BTC at the 2024 cycle peak to a distribution deficit of 188,000 BTC in the current period. This monumental friction between modernized institutional accumulation via ETF vehicles and methodical distribution by large legacy holders is the primary driver of the prolonged lateral consolidation.
Strategic Capital Flow Comparison — Q1 2026
| Investment Vector | Direction | Estimated Volume | Impact |
|---|---|---|---|
| Spot Bitcoin ETFs (US) | ✅ Net inflows | +$1.2B | End of 4-month outflow streak — institutional accumulation |
| Corporate Treasuries | ✅ Direct purchases | +$1.56B | Price-inelastic buying pressure absorbing floating supply |
| Whales (1k–10k BTC) | 🔴 On-chain distribution | −188,000 BTC | Historical selling pressure blocking upside breakouts |
| Derivatives Liquidations (24h) | 🔴 Forced closures | −$262M | Excess leverage cleanup, favoring floor formation |
| Spot Demand (30d) | 🔴 Contraction | −63,000 BTC | Temporary retail retreat, offset by OTC flows |
🔥 Microstructure & Liquidity Heatmap Analysis
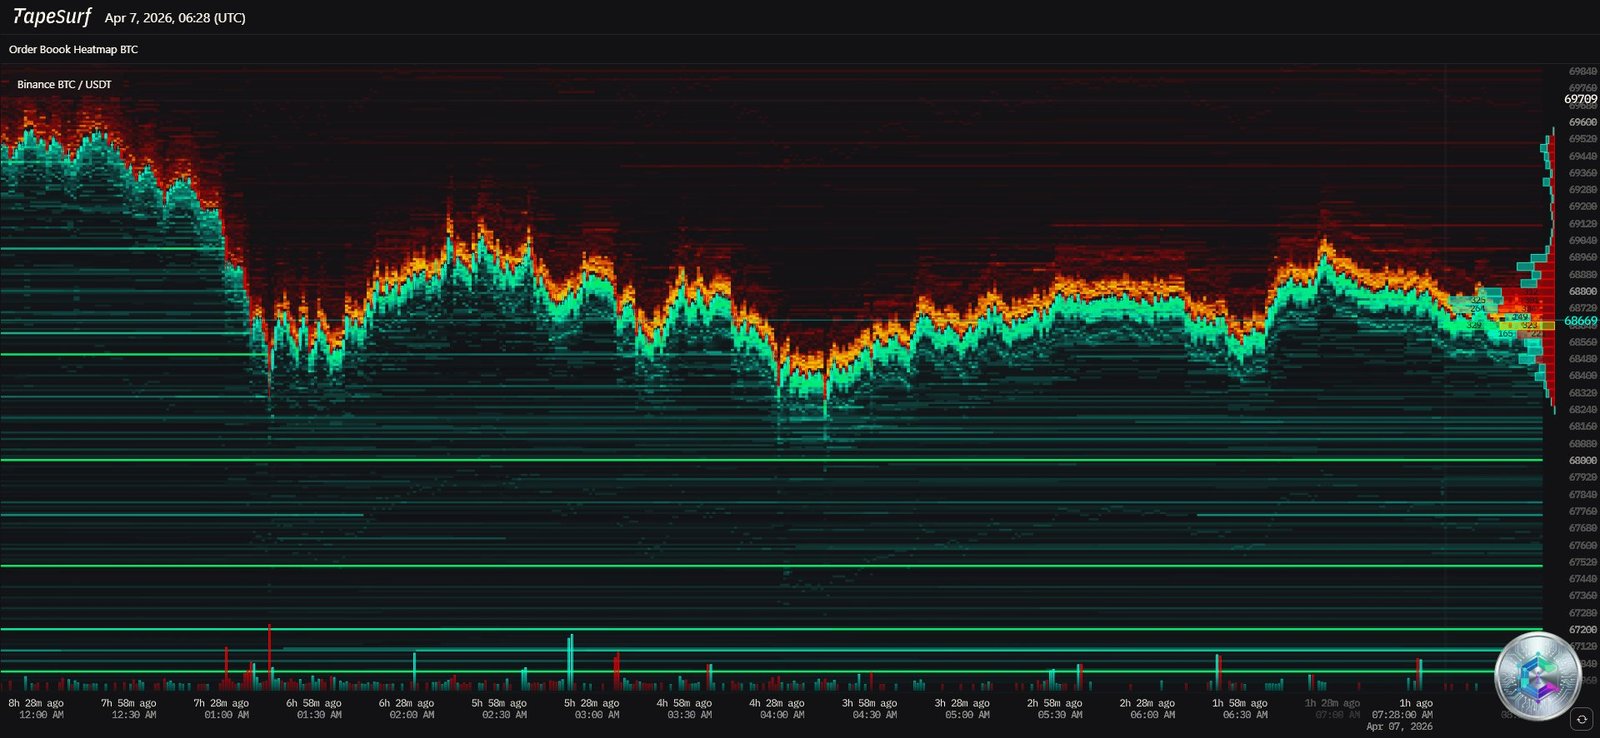
The TapeSurf liquidity heatmap analysis (Binance BTC/USDT) reveals a market caught between massive order walls. Price, oscillating around $68,669, is evolving in an environment of extreme compression — a coiled spring storing kinetic energy that will release decisively in the direction of the order book breakout.
To the upside: Dense sell order bands extend prominently between $69,500 and $70,000. Beyond this first rampart, aggregated data indicates another systemic-scale cluster between $90,900 and $92,200, housing a massive concentration of short positions. Higher still, around $93,500, resides a « whale » cluster estimated at a staggering $4.5 billion in selling liquidity. A breakout above $70,000 would mechanically trigger a chain reaction — an algorithmic Short Squeeze of extreme violence.
To the downside: Strategically positioned buy walls appear in staggered layers around $67,000, then descending toward $65,000. A decisive break below this level would open a liquidity trap toward $63,000–$64,000, or even $60,000. Positions levered at 40x–100x transform every micro-movement into a major liquidation event.
📊 Multi-Timeframe Technical Analysis
Daily Chart (1D) — Structural Erosion
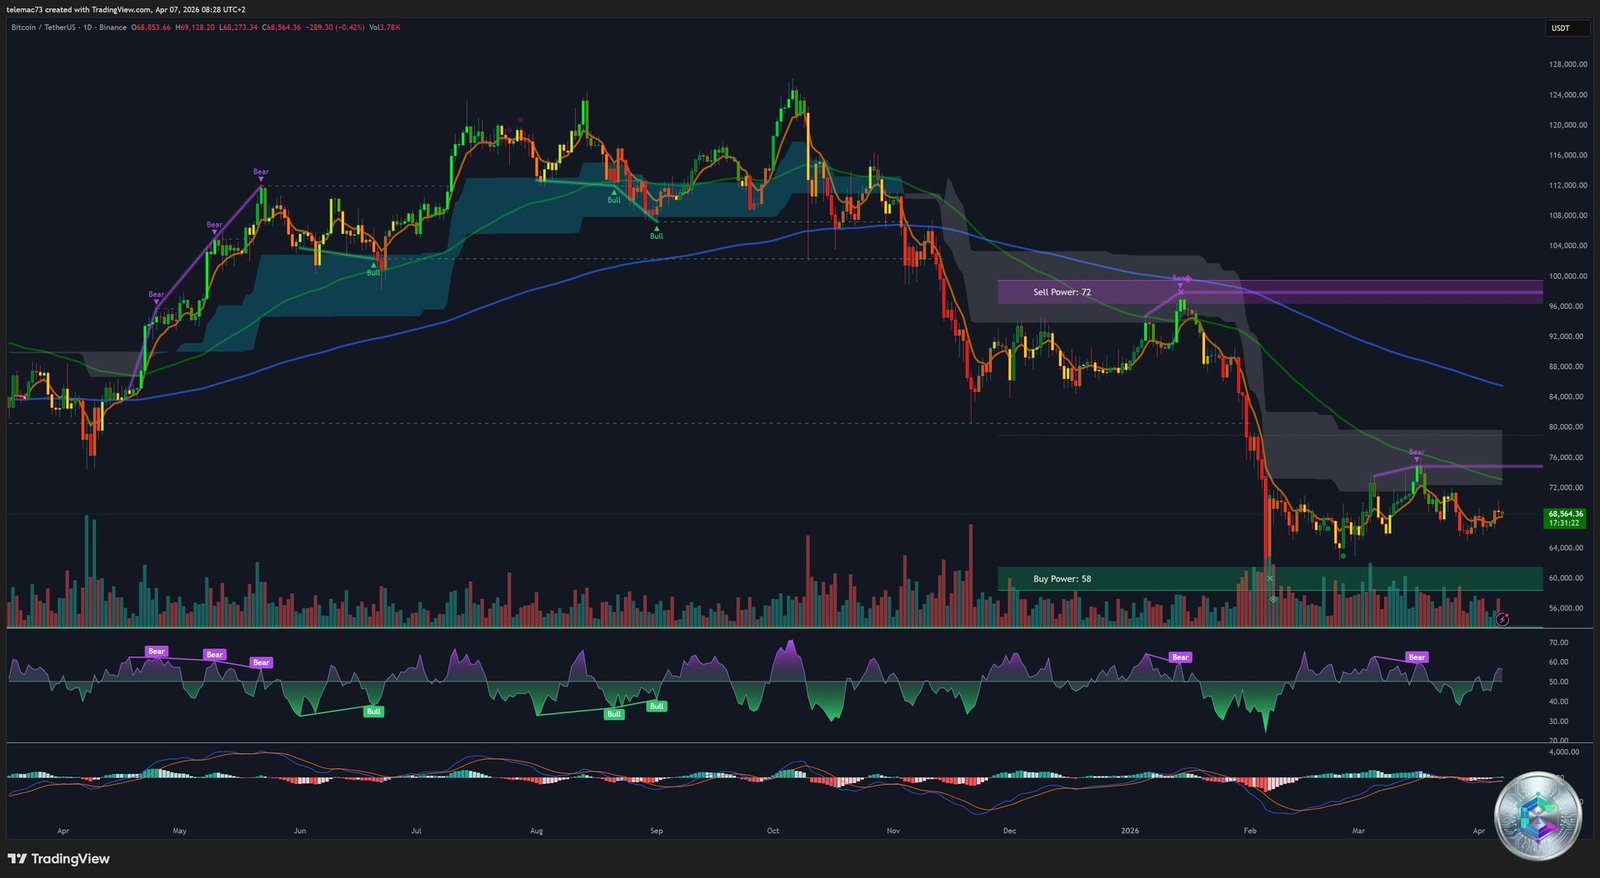
The daily chart retraces the vertiginous fall from the all-time high recorded in October 2025 above $126,000, marking a severe correction of nearly 47%. Price action inscribes itself within a classic descending channel, with each recovery attempt being mercilessly stopped at a level lower than the previous one — the textbook lower highs sequence.
Price evolves precariously below the 50-day SMA (≈ $70,658), which acts as an implacable dynamic resistance. More fundamentally, the 200-day EMA — universally recognized as the ultimate arbiter separating bull and bear market regimes — sits in a distant upper channel estimated between $85,000 and $96,639. The gaping distance between current spot price and this EMA 200 spectacularly illustrates the depth and entrenchment of the intermediate bearish trend initiated in late 2025.
A critical statistical anomaly: five consecutive monthly red candles in Q1 2026 — a sequence not observed since the capitulatory bear market collapse of 2018–2019. Elliott Wave Theory provides a relevant reading framework: after completing a magnificent five-wave impulsive cycle from 2022 lows to the 2025 peak, Bitcoin is currently embroiled in a lengthy three-phase corrective structure (A-B-C).
4-Hour Chart (4H) — Imminent Compression
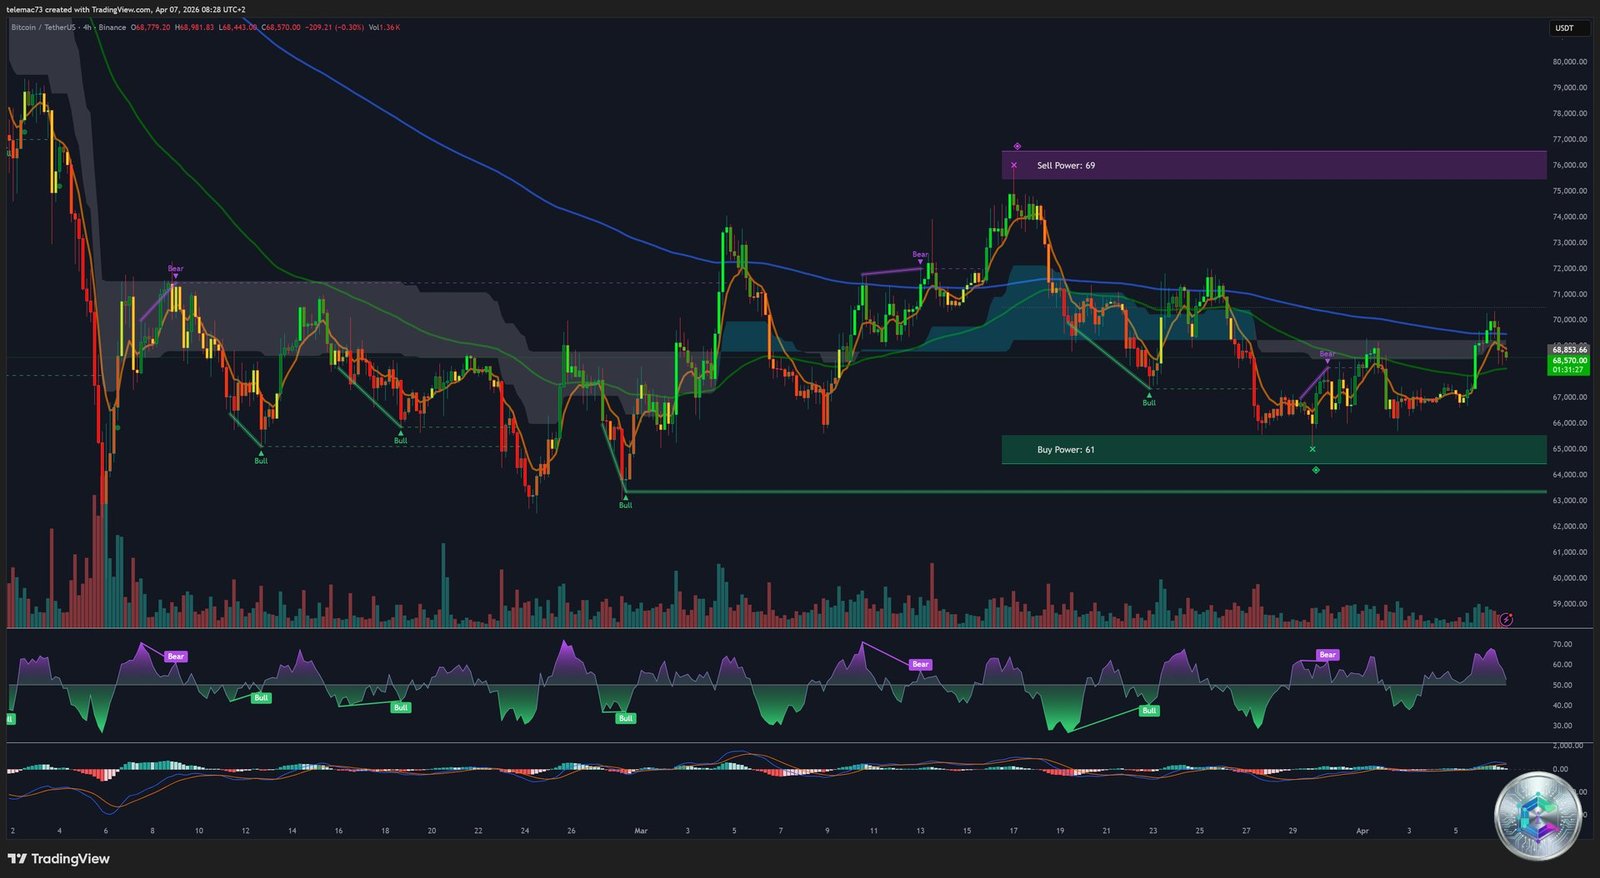
Zooming into the 4-hour timeframe reveals the tactical consolidation mechanics with heightened clarity. The market is strictly confined in a compressed volatility regime, oscillating between the rigid bounds of $66,000 and $70,000. Recent candles form an unmistakable profile of lower highs converging toward a resilient horizontal baseline — the perfect geometry of a Descending Triangle. In classical technical analysis doctrine, this pattern translates the progressive exhaustion of buyers; repeated tests of the lower boundary increase exponentially the probability of a violent breakdown.
Quantitative overlays display a moderate Sell Power of 69 vs Buy Power of 61, illustrating a precarious but seller-dominated balance. The RSI navigates neutral territory (45–55), without an oversold signal. The MACD histogram shows progressive atrophy of bullish momentum within the triangle — if this weakness persists, an inevitable bearish Death Cross on the 4H MACD will precipitate the triangle’s resolution toward its lower support.
15-Minute Chart (15m) — Algorithmic Noise
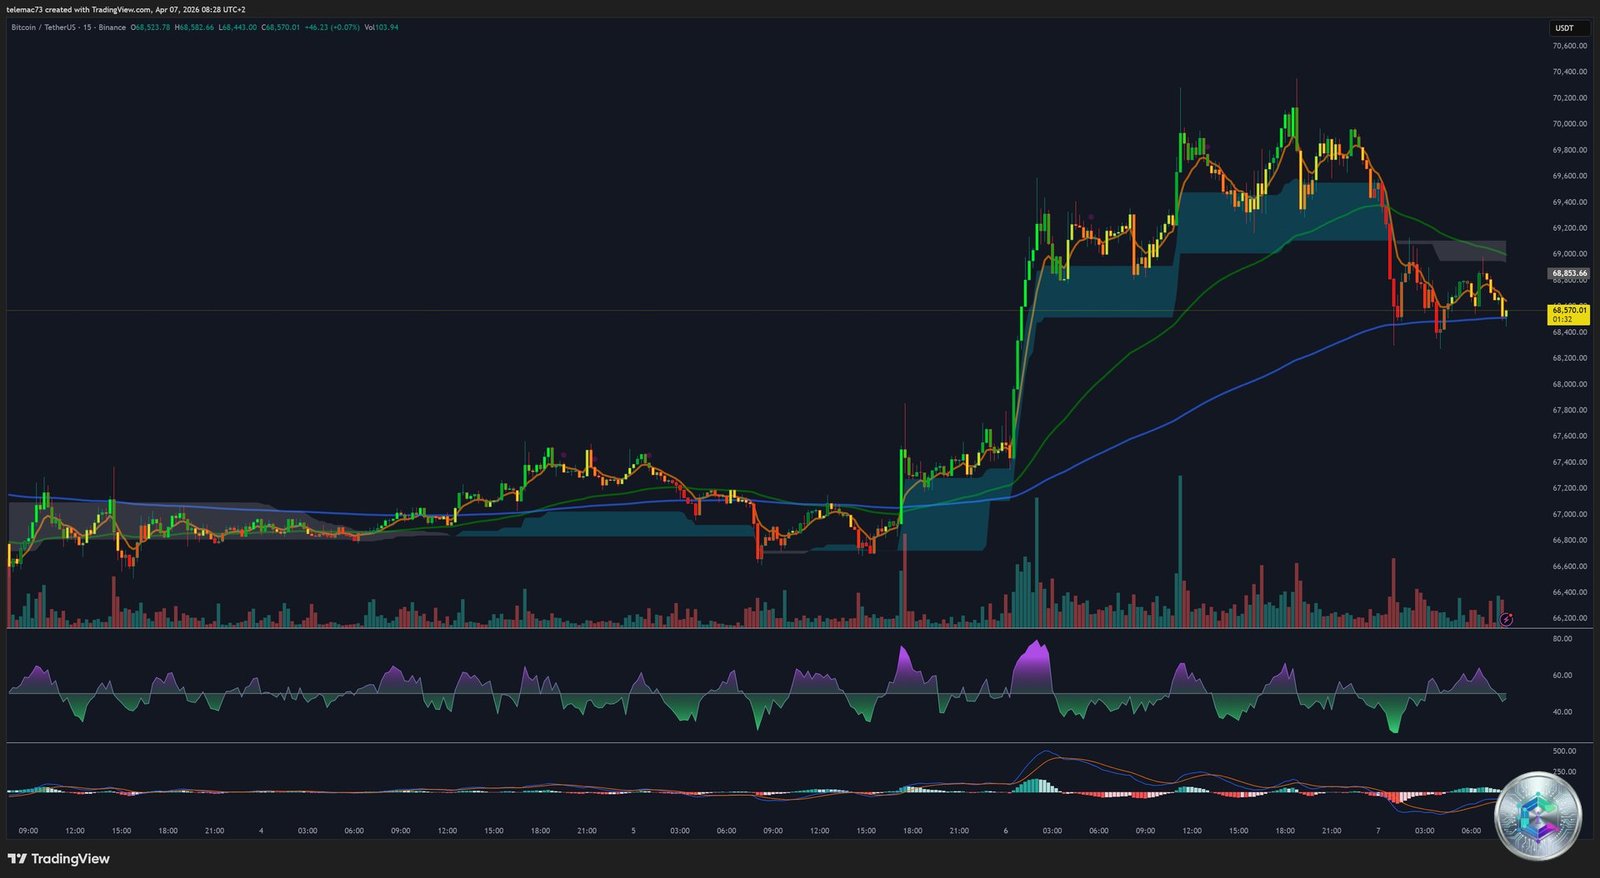
The 15-minute intraday scale plunges us into the heart of high-frequency algorithmic warfare. Price action is erratic and choppy — a brutal drop followed by an almost instantaneous V-shaped recovery back toward $68,570 — characteristic of an anemic liquidity environment following the Easter long weekend (Good Friday liquidity drain). The On-Balance Volume (OBV) evolves chaotically without providing any directional clarity. Multiple micro bear flag formations appear, systematically resolving with violent downside breaks. The Stochastic RSI repeatedly flirts with the overbought zone (78.07), continuously warning intraday traders of imminent corrective moves.
🎯 Key Level Mapping: Pivots & Fibonacci
| Level | Price (USD) | Technical Significance |
|---|---|---|
| 🔴 Squeeze Zone (R2) | $74,000–$75,000 | Short Squeeze target if R1 is blown through on high volume |
| 🔴 Major Resistance (R1) | $69,000–$70,000 | Massive psychological glass ceiling + heatmap liquidation cluster |
| ⚪ Equilibrium Pivot (Spot) | $68,775 | Current epicenter of institutional vs. retail friction |
| 🟢 Immediate Support (S1) | $65,000–$66,000 | Descending triangle base, algorithmic liquidity convergence point |
| 🟢 Intermediate Support (S2) | $63,000–$64,000 | Immediate liquidity target if $65k breaks decisively |
| 🟢 Macroeconomic Floor | $60,000–$62,000 | Lower bound of year-long consolidation range, deep Fibonacci levels |
| ⚫ Ultimate Fibonacci Base | $59,672 | Theoretical take-profit target for a short position on the weekly chart |
The spatial convergence of the oblique descending trendline, the horizontal R1 resistance, and the market profile volume peak around $69,500–$70,000 makes this zone the absolute decisive battleground. As long as this fortress is not taken and held on a daily close, the structural directional bias remains unambiguously bearish.
🔮 Predictive Synthesis: Two Scenarios for Q2 2026
📈 Bullish Scenario — Short Squeeze Extraction
Invalidating the current bearish thesis requires Bitcoin to initiate a momentum-driven move — supported by massive volume — breaking and closing above the $69,000–$70,000 resistance wall, and reclaiming the 50-day SMA ($70,658). This breakout would mechanically trigger the liquidation algorithms stacked in the heatmap, forcing short sellers to cover, propelling the asset ballistically toward $74,000–$75,000.
Required catalysts: proven stabilization of the oil market, verifiable geopolitical de-escalation in the Strait of Hormuz, and dovish Fed signaling at the FOMC meeting of April 28–29. The post-Halving 2024 structural context — with mined supply inflation reduced to less than 1% annually — would then act as a spectacular asymmetric force multiplier against freshly injected fiat liquidity.
📉 Bearish Scenario — Structural Capitulation
The persistence of deleterious macroeconomic pressures (aggressive tariff policies, ongoing geopolitical conflict, stubborn energy inflation) will invariably weigh on risk-curve asset valuations. The definitive trigger validating this scenario: a decisive break and daily close below the $65,000 psychological and technical bulwark. The loss of this last line of defense would invalidate lateral consolidation theses and activate an aggressive downside liquidity hunt toward the vulnerable $63,000–$64,000 zone.
A more pronounced deterioration — signaled by the « Death Cross » observed on weekly exponential moving averages and persistent uninterrupted monthly bearish candles — would inexorably force price toward the fundamental Fibonacci extension at $59,672. This would complete the Elliott corrective wave theory, creating the final necessary purge to lay the healthy foundations of the next great bull cycle. The market sits on a razor’s edge; current equilibrium is merely a statistical illusion preceding a move of implacable directional violence.
⚠️ Disclaimer: This article is written for exclusively educational and informational purposes. It does not constitute investment advice, a recommendation to buy or sell, or an inducement to engage in any financial transaction. Cryptocurrency markets are extremely volatile and carry risks of total capital loss. Please consult a qualified financial advisor before making any investment decision.