
As of April 5, 2026, Bitcoin (BTC) is navigating a consolidation phase of rare complexity, caught at the confluence of macroeconomic shocks, systemic geopolitical disruptions, and a fundamental technological reassessment. The asset oscillates nervously between $65,725 and $67,443 — a staggering contraction of nearly 47% from its All-Time High of $126,198 reached on October 7, 2025.
The Macroeconomic Vise: Geopolitics and Energy
Global financial markets are held hostage by an unprecedented escalation of military tensions in the Middle East. Statements from the Trump administration suggesting potential airstrikes against Iran have obliterated any optimism for a rapid diplomatic resolution. Bitcoin reacted immediately, dropping 3.6% within hours to touch a low of $65,709.
The most direct consequence of this geopolitical instability is the violent dynamics in energy markets. Brent crude surged 49.9% and WTI jumped 48.6% over the course of March, briefly exceeding $110 per barrel. This energy price spike revives the specter of persistent inflation and reinforces institutional risk aversion, diverting capital flows away from crypto assets.
Sovereign Rate Repricing and Liquidity Contraction
The resurgence of energy prices instantly translated into upward revisions of medium-term inflation expectations. The US 10-year Treasury yield climbed dramatically from 3.97% at the end of February to 4.3% by end of March, acting as a massive liquidity vacuum draining capital flows away from speculative asset classes.
The VIX rose from 19.86 to 25.25, reflecting a structural portfolio adjustment rather than blind forced selling. Gold surprisingly dropped more than 10% in March, suggesting cross-asset liquidations to meet margin calls or build dollar reserves. In this macro maelstrom, Bitcoin’s correlation with the Nasdaq strengthened, temporarily erasing its value proposition as an uncorrelated store of value.
Fundamental Risk Vectors: Quantum, ETF Hemorrhage, and DeFi Contagion
The Quantum Threat (The « Q-Day » Scenario)
Google’s quantum research team published a technical document asserting that the computing power required to break Bitcoin’s Elliptic Curve Cryptography (ECC/ECDLP-256) has been drastically overestimated. A fault-tolerant quantum computer with fewer than 500,000 physical qubits — a 20-fold reduction from previous models — could theoretically compromise this architecture. While no such machine currently exists, the action window has narrowed considerably, pushing institutional investors to factor this existential risk into their discount models.
The Spot ETF Hemorrhage
The institutional flow dynamics that powered the phenomenal 2024-2025 Bitcoin rally have completely reversed. US spot Bitcoin ETFs have experienced more than $3 billion in net outflows since the start of the year. The average cost basis for 2025/2026 ETF buyers sits at the vertiginous level of $83,956, meaning this massive pool of institutional capital is sitting on paper losses exceeding 23%. Subject to strict risk committees and drawdown constraints, these entities are systematically dumping more than 600 BTC per day onto spot markets, smothering every technical rally attempt.
Drift Protocol Hack: DeFi Contagion on Solana
On April 1, 2026, Drift Protocol — Solana’s leading perpetual futures DEX — suffered a devastating exploit estimated at $200 to $270 million. The shockwave erased nearly a billion dollars of TVL within hours of panic, sending SOL down more than 11% to its existential support at $78. Through the cross-margin mechanics of multi-asset hedge funds, this forced liquidation mechanically transferred selling pressure onto Bitcoin — the most liquid collateral in the ecosystem.
Microstructural Analysis: The Liquidation Heatmap
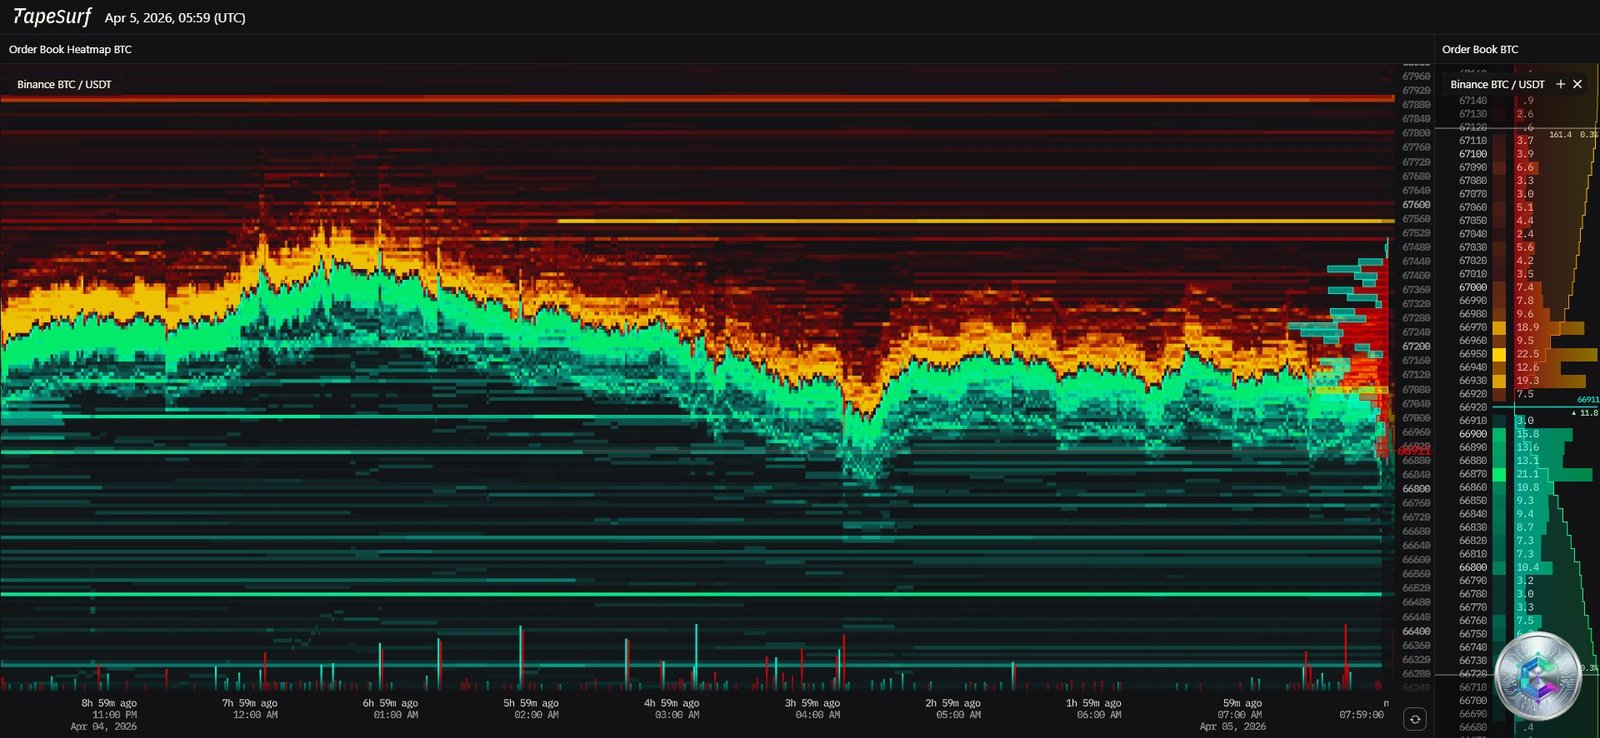
The TapeSurf heatmap reveals an environment dominated by overwhelming supply. Above the current price, massive horizontal bands of warm colors (red, orange, bright yellow) extend from $67,500 and densify considerably around $67,800–$68,000. These ask walls materialize millions of dollars in limit sell orders positioned by large operators, methodically repelling price at every upward incursion attempt.
Below $66,500, bid walls are noticeably sparse. Should price capitulate below $66,000, it would encounter minimal resistance and could collapse through liquidity voids toward major thresholds at $63,000 or $60,000.
Multi-Timeframe Technical Analysis
Daily Chart: Anatomy of a Decline
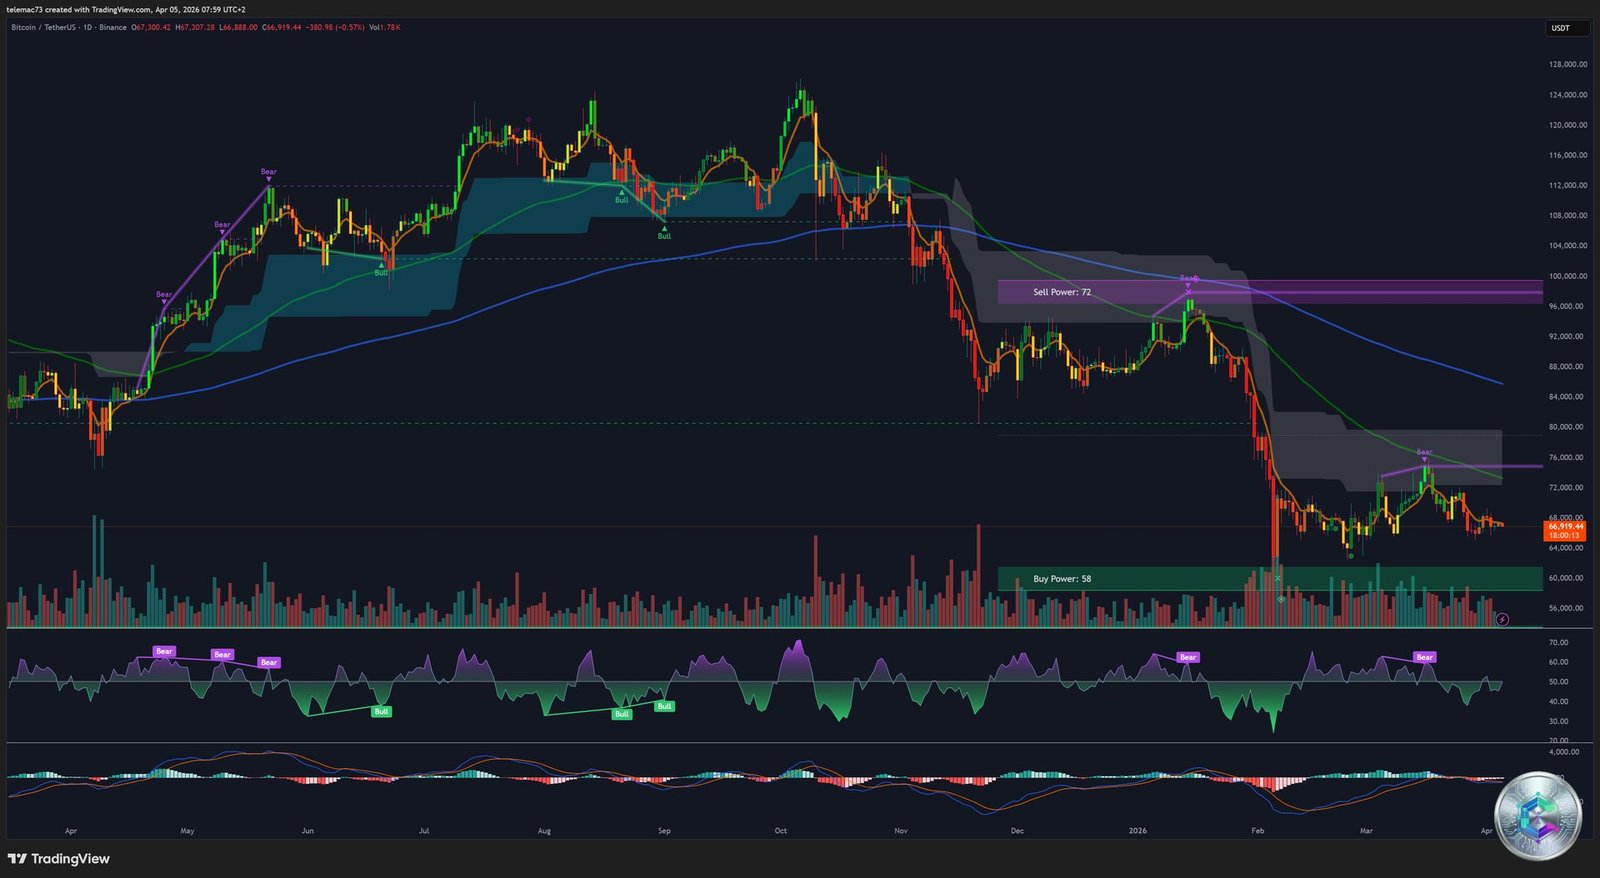
BTC is clearly trading within a major descending channel / Bear Flag continuation pattern, with the upper boundary running between $74,000 and $76,000. Every breakout attempt since February 8 has resulted in immediate and brutal rejection. The moving average configuration confirms advanced trend deterioration: price trades below the SMA50 (~$68,681) and SMA20 (~$69,870), both pointing south. The SMA200 has declined continuously since January 3, 2026, making an imminent Death Cross increasingly likely — the most feared technical confirmation of a prolonged bear market. The 14-period RSI hovers in a zone of strict neutrality (~52-57), leaving ample room for a dramatic collapse without triggering extreme oversold readings.
4-Hour Chart: Compression and Agony
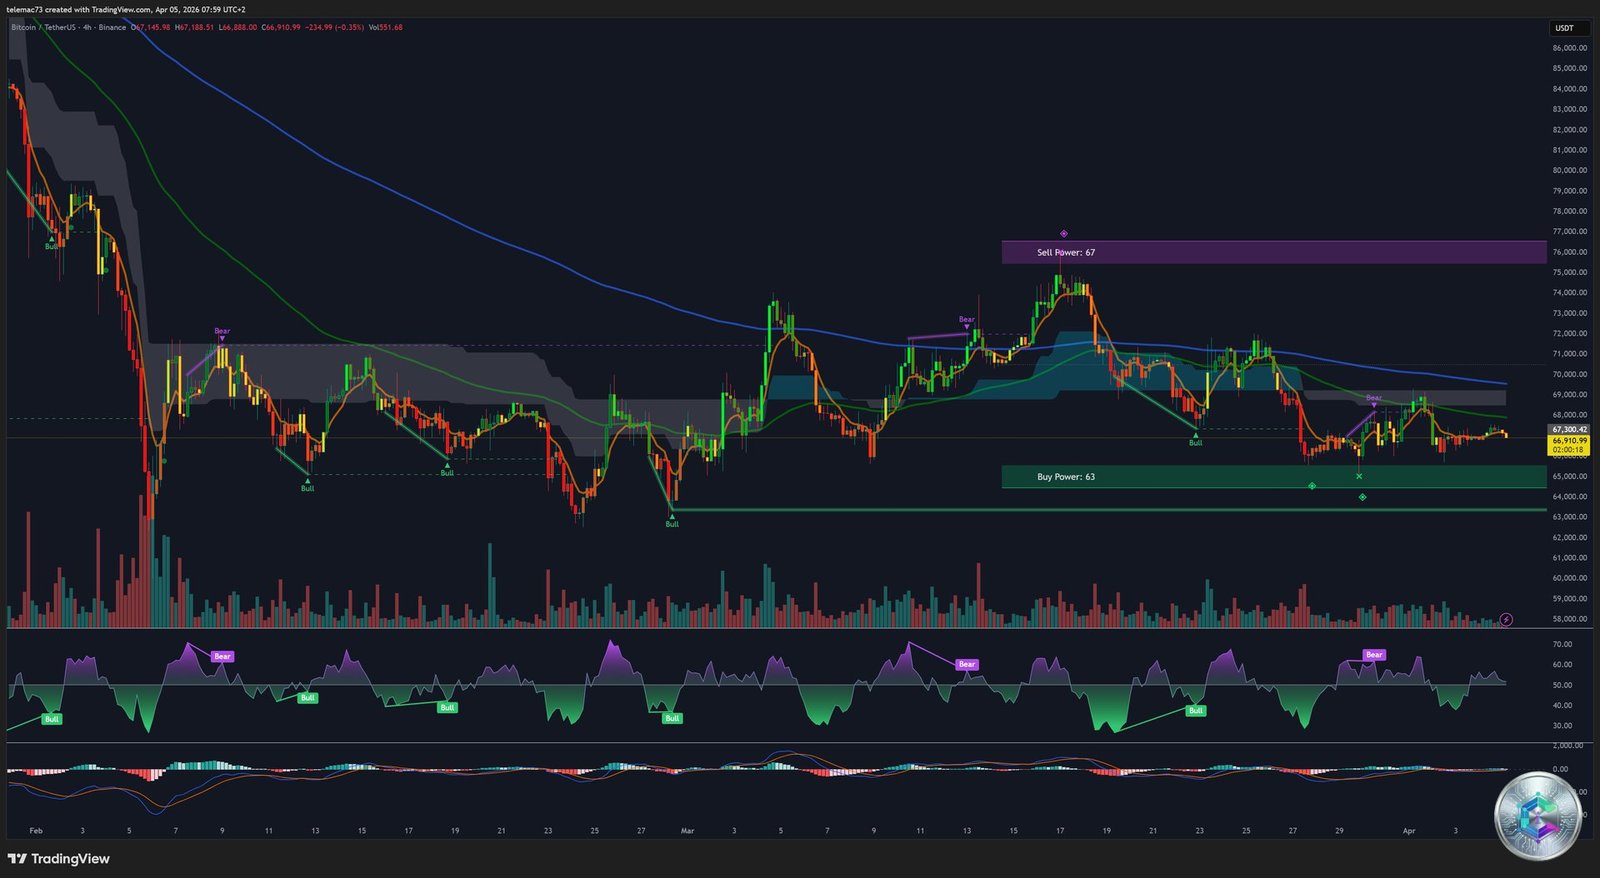
On the 4H timeframe, price locked around $66,910 is forming a symmetrical compression triangle with constantly contracting volume — a textbook setup preceding a violent directional break. The Bollinger Squeeze is imminent, with price dangerously touching the lower band at $64,972. The MACD, below the zero line, shows its histogram reverting to 0.0000, preparing a potential local Golden Cross that could fuel a technical dead-cat bounce. The Stochastic oscillator (K=25.27 / D=20.21) is deeply in oversold territory, offering a fragile hope of a tactical bounce toward the intermediate resistance at $68,490.
15-Minute Chart: The High-Frequency Trading Arena
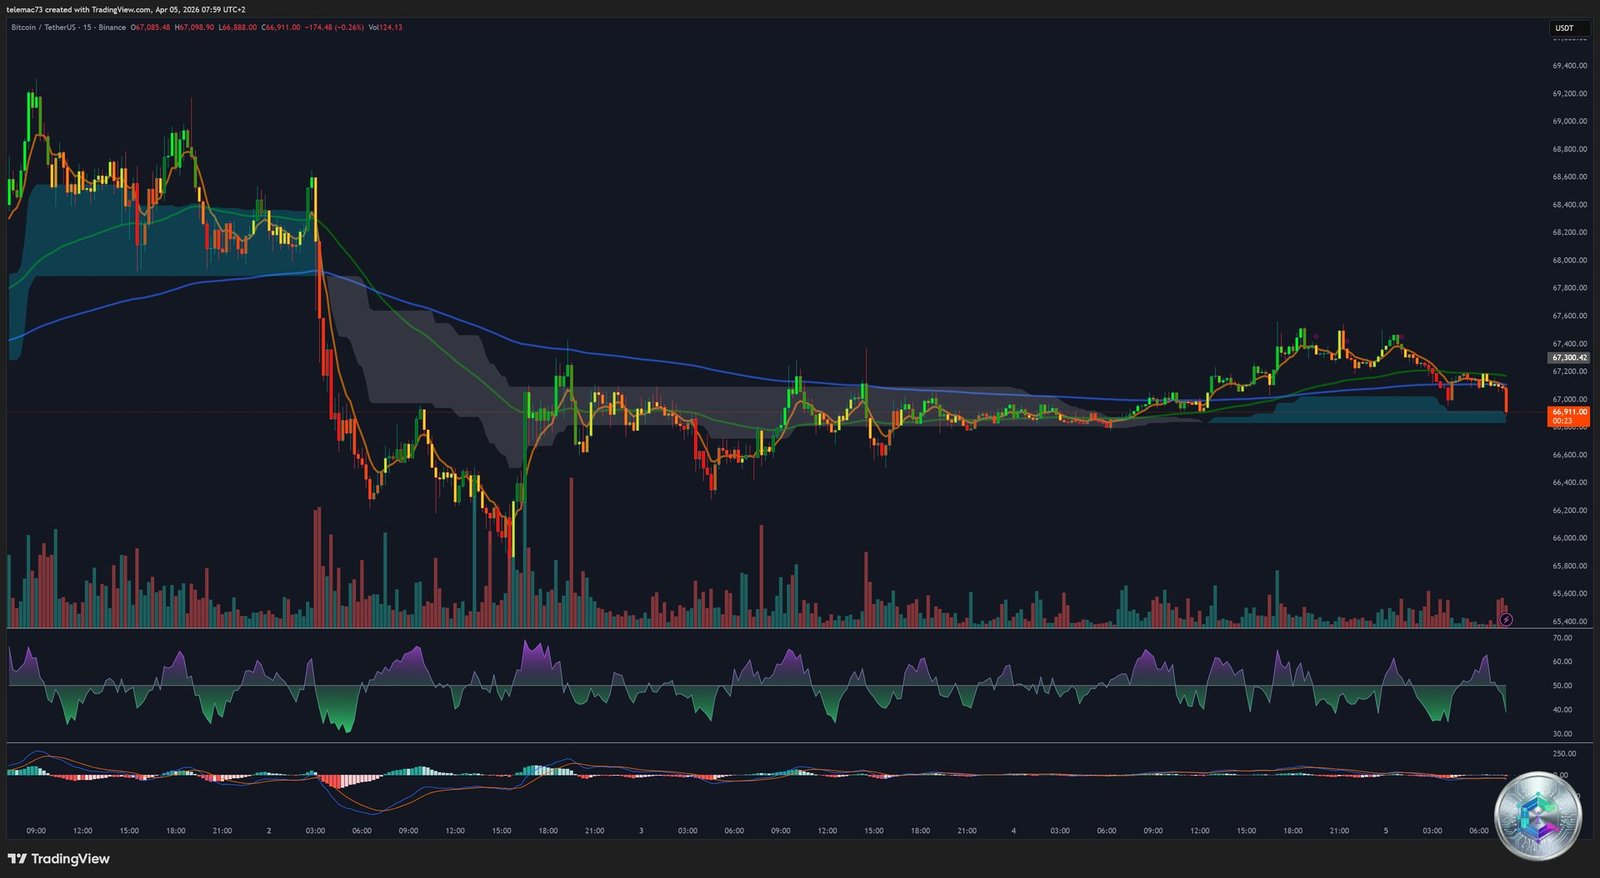
The M15 chart exposes the brutality of microscopic price fluctuations driven by HFT algorithms. Since the break below $68,000, price has crawled lethargically along the horizontal axis, peppered with bull traps and bear traps characteristic of the anemic liquidity typical of an Easter long weekend. The MA5 (~$67,310) acts as a suffocating dynamic resistance, crushing every retail buyer recovery attempt.
Key Level Mapping and Strategic Cartography
| Zone | Level | Role |
|---|---|---|
| Macro-structural ceiling | $74,000 – $76,000 | Major resistance — bear flag invalidation |
| Institutional supply barrier | $69,000 – $72,000 | Recent ETF realized price / overhead resistance |
| Short squeeze magnet | $78,000 – $82,000 | Cluster of short liquidations |
| Last line of defense | $64,960 – $65,618 | Recent March lows — critical support |
| Red line | $62,527 – $63,046 | February lows — absolute boundary |
| Capitulation zone | $52,500 – $55,000 | Elliott Wave C target / Deep Value entry |
On-Chain Data: The Shadow of Underwater Supply
Nearly 9 million BTC are currently held at a loss, dangerously approaching the historical peak of 10 million BTC seen at the extreme lows of 2018, 2022, and post-FTX. In each prior episode, this level of underwater supply invariably preceded additional 25%+ bear market purges before any structural stabilization occurred. The 1-3 month holder cohort’s realized price stands around $90,000, transforming this level into an implacable resistance ceiling where every mechanical bounce triggers systematic relief selling.
Price Scenarios: Elliott Wave Trajectories
Bearish Scenario (High Probability): Bitcoin is completing a post-impulse ABC correction. The current lethargy below $70,000 matches an exhausted Wave B. A break of the critical support zone at $64,960 will trigger stops below the lower Bollinger Band, precipitating a move toward $52,500–$57,000 (Wave C / bear flag breakdown target). This scenario aligns with persistent Fed hawkishness, the quantum computing threat, and the ongoing geopolitical crisis.
Bullish Scenario (Low Immediate Probability): A rapid Iran-Israel diplomatic de-escalation triggering an oil crash and Treasury yield relief, combined with ETF inflows exceeding $500M/week, would allow a daily close above $69,537 (April 1 high). Destruction of the $72,000 level would then ignite a short squeeze fuel burn, creating algorithmic momentum toward the $78,000–$82,000 short liquidation cluster.
Strategic Positioning Recommendations
- Deleverage and reduce convexity: The high ATR and algorithmic liquidity hunts make asymmetric leverage extremely dangerous. Intraday position sizing must remain below 1% of managed capital to survive news-driven erratic deviations.
- Disciplined patience as primary methodology: No serious fresh capital allocation is technically or fundamentally justified at current valuations ($66,000–$67,000). Bullish confirmation requires a clean, high-volume break above $72,000 — the full bear flag invalidation.
- End-of-cycle accumulation opportunity: A long-horizon macro manager who integrates the network’s historical resilience will view a potential decline toward the $52,500–$55,000 zone not as a tragedy, but as the ultimate cycle cleansing — the ideal Deep Value structural foundation for the next secular wealth-creation phase.
⚠️ Disclaimer: This article is written for strictly educational and informational purposes only. It does not constitute investment advice, a recommendation to buy or sell, or any solicitation to invest in digital assets. Cryptocurrency markets are highly volatile and carry significant risk of capital loss. Please consult a licensed financial advisor before making any investment decisions.