
As of March 31, 2026, Bitcoin (BTC) trades within a narrow, high-tension range of $67,414 to $69,984, displaying apparent short-term resilience against unprecedented macroeconomic, geopolitical, and structural headwinds. Beneath the surface, the market is deeply fractured — extreme retail fear on one side, massive institutional accumulation silently building on the other. This report provides a comprehensive, clinical breakdown of every dimension driving this historic configuration.
1. Macroeconomic Context: The Macro-Driven Capitulation
Bitcoin’s price action cannot be decoupled from its broader macroeconomic environment. The market is currently dominated by a phase of macro-driven capitulation, where global liquidity fluctuations and monetary policy ruthlessly dictate capital flows toward risk assets.
1.1 The Federal Reserve and the Inflation Vise
The imminent release of Personal Consumption Expenditures (PCE) data constitutes the central pivot for global financial markets. A core PCE reading above 3.0% year-over-year would virtually eliminate residual hopes for a June 2026 rate cut, perpetuating bearish mechanical pressure on Bitcoin through the classic trifecta: high rates → strong dollar → attractive Treasury yields.
Conversely, a core PCE below 2.6% would signal confirmed disinflation, weakening the dollar and reigniting risk appetite — potentially propelling BTC toward the $73,000–$75,000 resistance zone. Adding a binary layer of uncertainty: Jerome Powell’s mandate expires in May 2026. A dovish successor could catalyze a massive risk-asset rally; a hawkish one would extend the liquidity winter indefinitely.
1.2 Geopolitical Tensions and the Oil Transmission Channel
Recurring instability in the Strait of Hormuz has created a toxic sell-the-news environment paralysing buyer initiative. If Brent crude sustains above $100/barrel, reinflation fears materialize instantly, forcing the Fed to maintain its restrictive stance. The five-day ceasefire announced in late March 2026 offered a volatile relief rally, but the extreme fragility of diplomatic negotiations keeps the market in a state of severe conditional volatility.
1.3 FTX Distribution: $2.2 Billion Supply Overhang
On this March 31, 2026, the FTX Recovery Trust’s fourth distribution phase releases approximately $2.2 billion to creditors from the November 2022 collapse. Historically, such events generate a feared supply overhang, inducing 5%–8% corrective declines. The psychology is telling: since claims are valued at November 2022 lows (~$16,000), many creditors may choose to cash out in fiat rather than re-enter BTC near $70,000 — exacerbating spot demand weakness.
2. The Existential Mining Pivot Toward Artificial Intelligence
For the first time since 2020, Bitcoin’s network hashrate dropped 3%–4% in Q1 2026, falling back around 1 zettahash per second. This contraction signals a massive industrial-scale reallocation of capital and energy.
2.1 The Unsustainable Post-Halving Equation
Following the April 2024 Halving (block reward cut from 6.25 to 3.125 BTC), combined with rising global energy costs, the average cash cost of producing one Bitcoin has reached approximately ~$80,000 for many North American public miners. With spot prices around $67,800, the operational loss is roughly $19,000 per BTC mined and liquidated. Only the most efficient operations, with power purchase agreements enabling costs between $34,000–$43,000, are surviving.
2.2 The Rush to AI: Major Deals Summary
Miners possess three structural assets AI companies desperately seek: direct access to massive power sources (gigawatts), advanced cooling infrastructure, and already-operational data centers. More than $70 billion in AI-related infrastructure contracts have been signed in the public mining sector in recent months:
| Company | Deal Type | Estimated Value | BTC Impact |
|---|---|---|---|
| Core Scientific (CORZ) | CoreWeave Hosting | $10.2B / 12 years | 200 MW allocated to AI, $175M BTC sold to fund transition |
| Hut 8 (HUT) | Google-backed lease | $7B / 15 years | Full rebranding as AI infrastructure company |
| TeraWulf (WULF) | HPC contracts | $12.8B contracted | Energy power redirected to higher-margin AI |
| Riot Platforms (RIOT) | AMD lease (Corsicana) | ~$25M net operating revenue/yr (Phase 1) | 600 MW under evaluation for full AI/HPC conversion |
| MARA Holdings (MARA) | Dedicated AI infrastructure | Funded via BTC reserve liquidation | Sale of 15,133 BTC ($1.1B) in March 2026 |
This migration, while essential for corporate survival, drives a massive liquidation of BTC treasury reserves. Miners are no longer buyers of last resort — they are forced sellers. As long as BTC remains below $80,000, this mechanical selling pressure will act as an institutional glass ceiling, absorbing any emerging buy-side liquidity.
3. Market Sentiment and On-Chain Data: A Historic Dichotomy
3.1 Fear & Greed Index: The Abyss of Extreme Fear
As of March 31, 2026, the Crypto Fear & Greed Index sits between 8 and 11 out of 100 — deep in « Extreme Fear » territory. Stablecoins have reached a historic combined market cap of $142 billion, signaling massive capital parking. Historically, sub-15 readings have preceded absolute market bottoms: March 2020 COVID crash, June 2022 Terra-Luna collapse, and November 2022 FTX bankruptcy. Perceived financial risk is maximal; actual investment risk is often minimal at these levels — though resolution can take weeks or months.
3.2 Stealth Institutional Accumulation
Behind the veil of public panic, on-chain data reveals a radically different picture:
- BTC dominance at 56.5% — a defensive capital rotation out of high-beta altcoins into Bitcoin.
- Exchange BTC reserves at 7-year lows — large buyers immediately withdrawing to cold storage, drastically reducing available floating supply.
- +0.4% of addresses holding >100 BTC during the correction — smart money methodically accumulating at the $65,000–$67,000 value zone.
- Bitcoin Spot ETFs: impressive $1.13B net inflows early March, but a sharp $296M net outflow in the final week signals fading institutional momentum.
4. Multidimensional Technical Analysis
4.1 Daily Chart: The Death Cross and Bear Flag
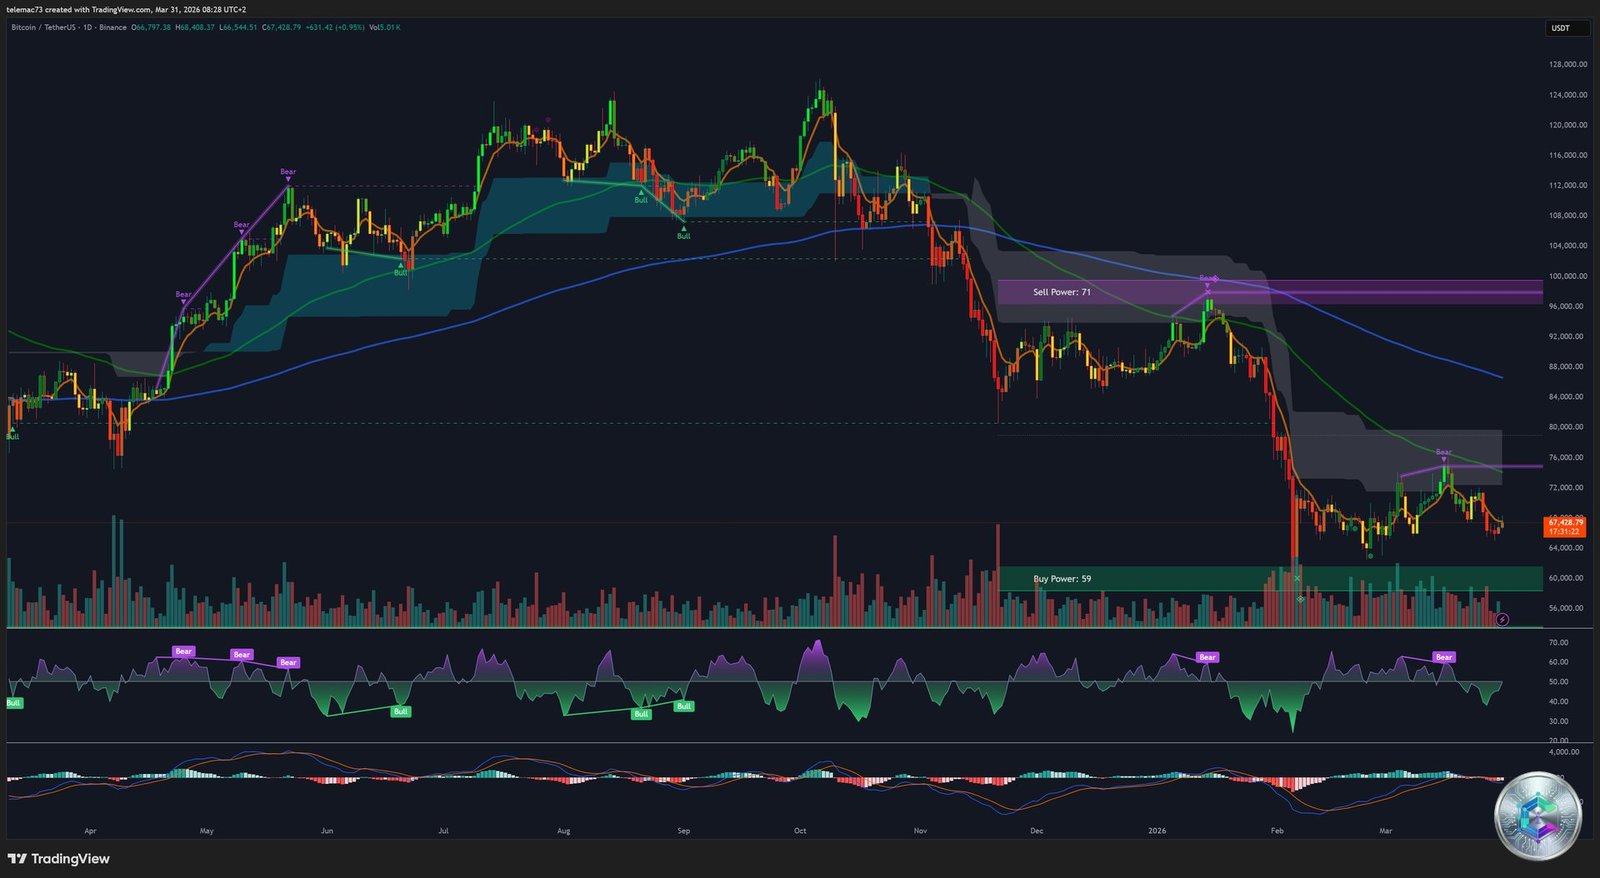
Death Cross: For the first time since the devastating crypto winter of June 2022, a Death Cross has validated on the 3-day chart and threatens to confirm on the daily. The 50-SMA (~$72,160) acts as a lead-weight resistance, with the 200-SMA hovering around $69,200. Historically, this signal preceded declines of 35%–59%, with strict mathematical projection pointing toward $38,000–$50,000.
Bear Flag: The ascending consolidation channel between $65,000 and $73,500 resembles a distribution pause before the primary downtrend resumes. The lower trendline (neckline) at ~$62,300–$65,000 is actively being tested. A confirmed breakdown would trigger a measured move targeting $41,400–$45,000.
Counter-thesis — Rainbow Chart: Long-term logarithmic regression models place BTC (~$67,500) squarely in the « BUY! » band ($56,134–$75,631), far below mid-cycle « Fair Value » ($125,972–$164,842). For investors with multi-year conviction, the current correction offers an exceptionally asymmetric risk/reward opportunity.
4.2 4-Hour Chart: Compression and Hidden Divergences
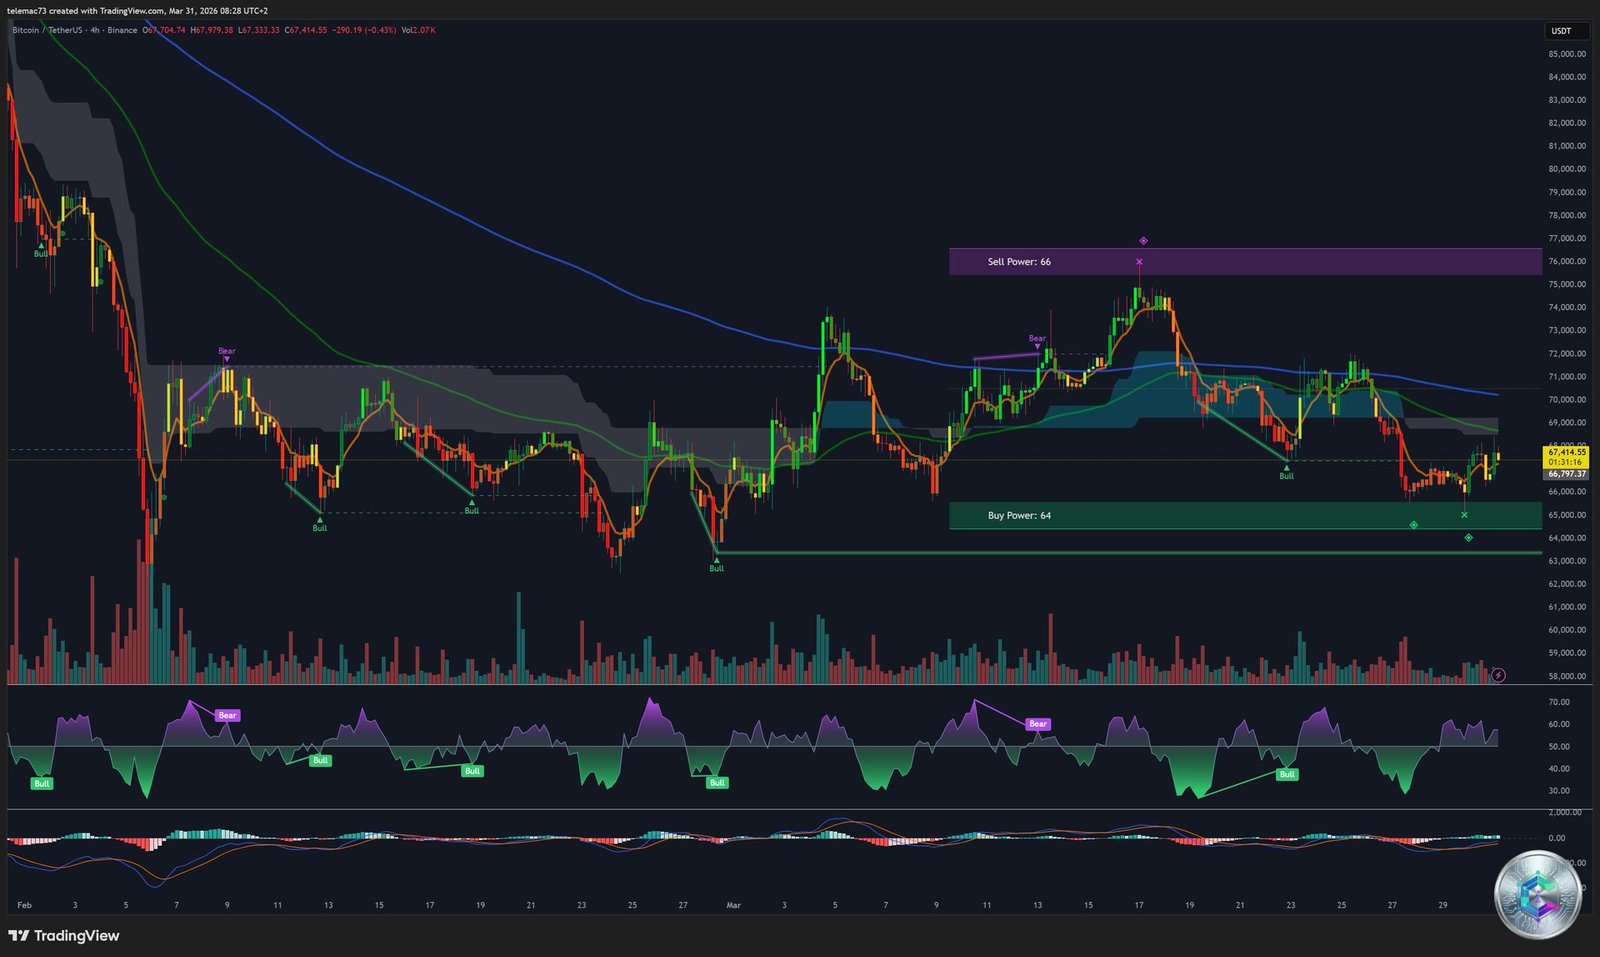
The H4 chart shows BTC trapped beneath a firmly bearish Ichimoku Cloud. A « Sell Power: 66 » zone looms near $76,000 while « Buy Power: 64 » attempts to hold a floor at $64,000–$65,000. Every attempt above $73,000 has been violently rejected, leaving long upper wicks — the signature of Wyckoff-style distribution where large portfolios dump into residual retail buying.
RSI (14 periods): Oscillating between 44–46, firmly bearish below the 50 midline. A critical bearish hidden divergence has formed: price attempts marginal local highs while RSI prints successively lower peaks. Next destination: oversold territory (<30).
MACD: Histogram clearly negative (red bars), MACD line having crossed its signal line to the downside. Any price bounce must be treated as a potential bull trap until a clear, volume-backed bullish crossover materializes.
4.3 15-Minute Microstructure and Liquidity Heatmap
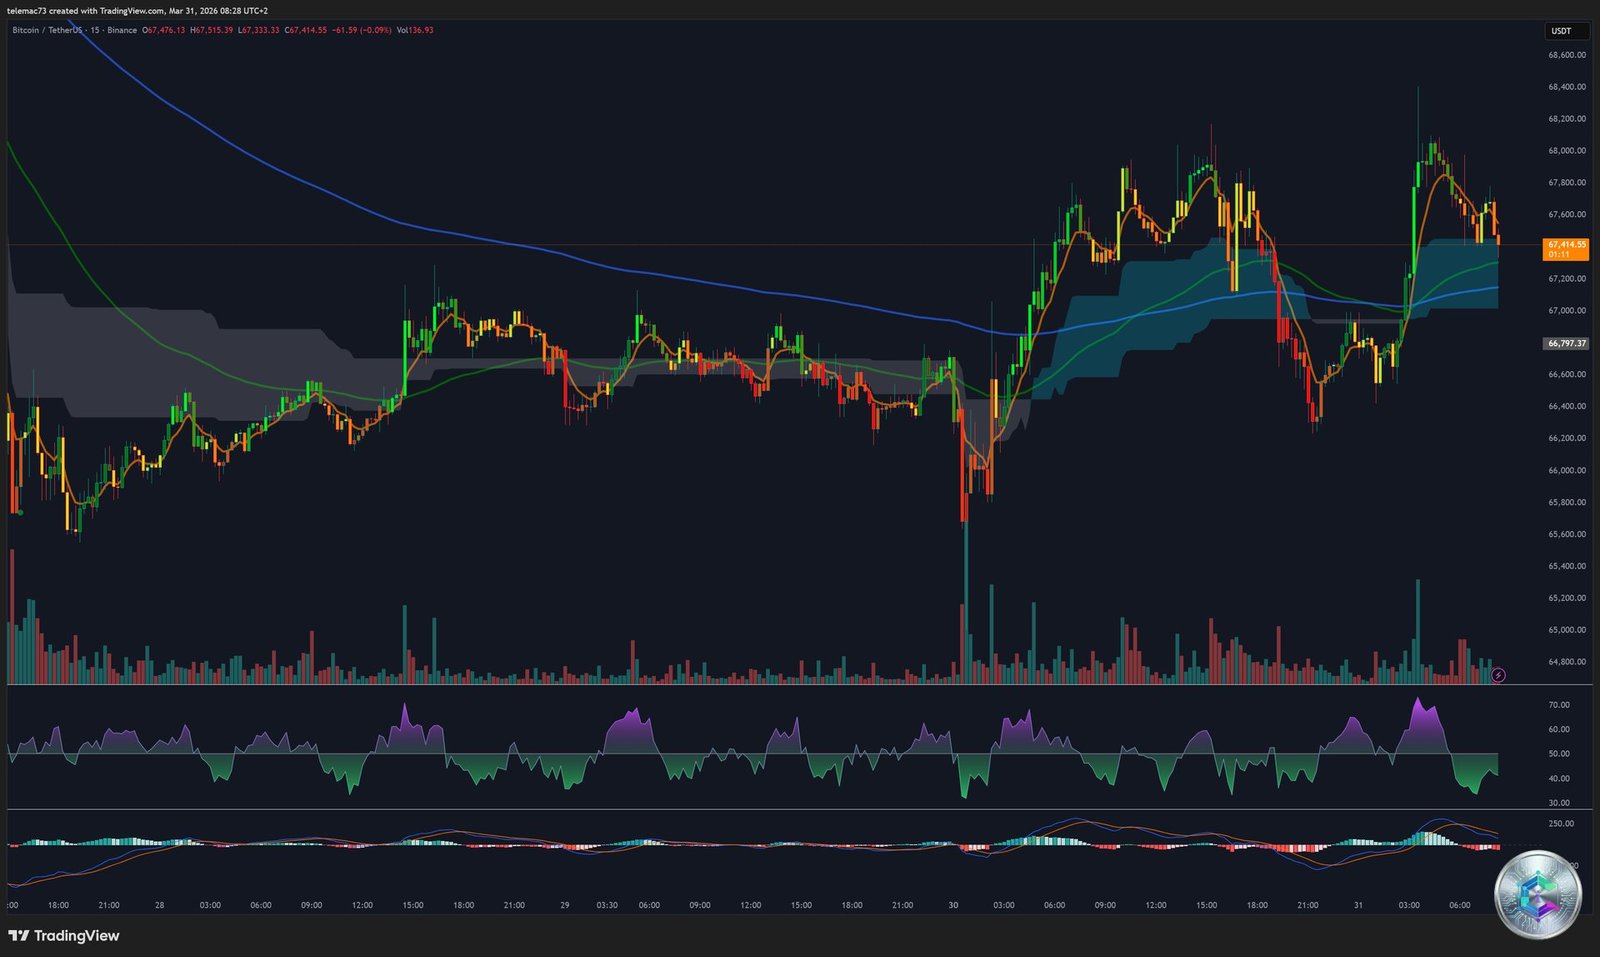
The 15-minute chart exposes the brutality of the ongoing algorithmic war: a flash crash from $66,500 to $65,000 triggered by a liquidation cascade of over-leveraged longs, immediately absorbed by institutional VWAP/TWAP algorithms defending the $65,000 floor. This absorption behavior confirms strong organic accumulation at these levels — particularly visible on Bitfinex order books.
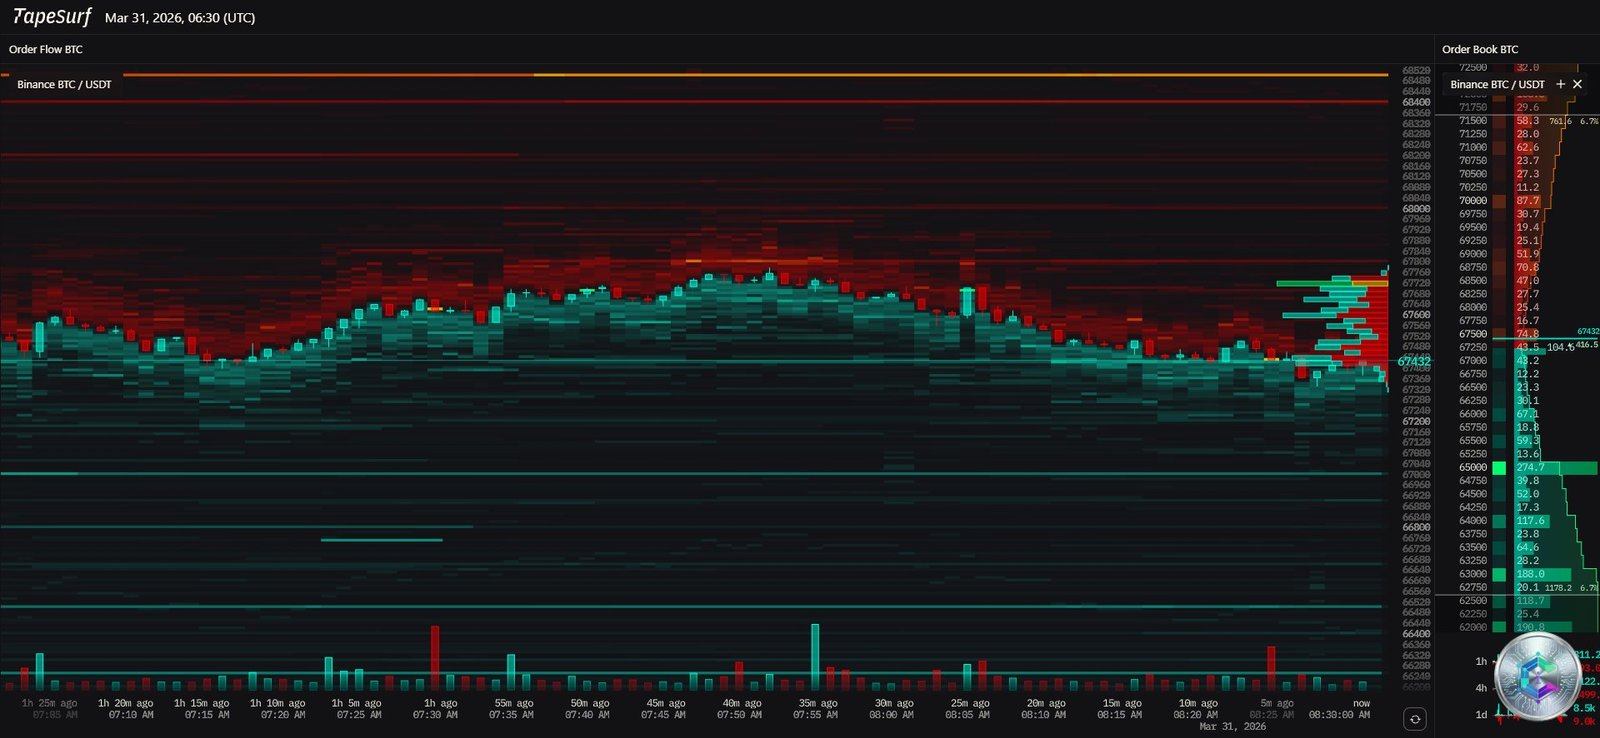
The TapeSurf heatmap exposes a striking north-south imbalance in market liquidity:
- Above: Thick red bands from $67,800 to $71,000+ — $12 billion of short liquidations clustered at $72,000–$75,000, coinciding with the « Max Pain » level of the $14.16B options expiry.
- Below: Thin blue support lines — only $3 billion of long liquidations, scattered fragmentarily down to $50,000.
This structure creates explosive tension: Market Makers have a massive financial incentive to push prices above $72,000 to trigger a devastating Short Squeeze — a self-reinforcing cascade of forced buybacks generating explosive upside volatility.
5. Strategic Price Levels: Pivot Point Matrix
Calculated based on March 30–31, 2026 price action:
| Model | S1 (Local Support) | Pivot Point | R1 (Local Resistance) |
|---|---|---|---|
| Classic | $66,649 | $66,810 | $66,931 |
| Fibonacci | $66,702 | $66,810 | $66,918 |
| Camarilla | $66,744 | $66,810 | $66,796 |
| Woodie’s | $66,629 | $66,800 | $66,911 |
| DeMark’s | $66,589 | ~$66,684 | $66,780 |
The extreme narrowness of Camarilla projections mathematically confirms maximum intraday volatility compression. The market is a fully compressed spring.
Key Resistance Zones
- $70,000 — Former support, now resistance (EMA 20 confluence)
- $72,160–$72,568 — Death Cross / 50-SMA / Bear Flag upper trendline confluence → the absolute technical Rubicon
- $75,000–$79,200 — Options Max Pain + long-term descending trendline → conquering this opens the path to new ATHs
Critical Support Zones
- $65,000–$67,000 — Institutional TWAP trench (current front line)
- $60,800–$62,300 — Bear Flag glass floor → breakdown triggers cascading long squeeze
- $50,000–$52,400 — Death Cross gravitational pit
- $41,400–$45,000 — Ultimate Bear Flag measured move objective
6. Probabilistic Scenarios for Q2 2026
Dominant Bearish Scenario — « The Delayed Winter »
The confluence of major negative signals — validated 3D Death Cross, breakdown of $70,000, textbook Bear Flag morphology, negative MACD histogram, ETF capital outflows — forms an overwhelming technical case for trend continuation. Structurally, the mechanical selling pressure from loss-making miners forced to fund AI infrastructure pivots, combined with the latent FTX distribution threat, creates continuous, emotion-insensitive selling barriers.
Sequence: Definitive rejection at EMA 50 (~$72,160) → breakdown of $65,000 → free-fall toward $50,000 → possible extension to $42,000.
Bullish Reversal Scenario — « The Asymmetric Compression and Short Squeeze »
Although technical surface analysis paints a grim picture, the structural foundations harbor powerful anomalies capable of fatally trapping short sellers. The market is drowning in suffocating pessimism (Fear & Greed locked at 8/100). In highly financialized zero-sum markets, paroxysmal bearish sentiment extremes invariably precede brutal, consensus-punishing trend reversals.
The physically observable $12 billion of over-leveraged short liquidations clustered just above $72,000 represents an irresistible financial incentive for Market Makers. An unexpected exogenous catalyst — surprise Middle East resolution, a dovish PCE print forcing early Fed rate cuts, or an emergency Treasury liquidity injection — would instantly ignite the algorithmic market, detonating a devastating Short Squeeze chain reaction.
Sequence: Trigger above $72,500 (with ETF volume spike) → instant Bear Flag and Death Cross invalidation → rapid frictionless ascent toward $80,000 → official reset of the macro bull cycle for H2 2026.
⚠️ Disclaimer: This article is published for educational and informational purposes only. It does not constitute investment advice, a recommendation to buy or sell, or an inducement to invest in cryptocurrencies or any other financial asset. Cryptocurrency markets are highly volatile and speculative. All investments carry risk of capital loss. Please consult a licensed financial advisor before making any investment decision.