
Bitcoin on the Brink: A Drop Below $60K Could Delay Recovery Until 2027
Bitcoin (BTC) has erased all of its March gains, currently down 1.40% on the monthly chart and 24.6% for the first quarter of 2026. This underperformance places the leading cryptocurrency at the center of an intense debate among analysts: has the cycle bottom already been reached, or is the worst still to come? On-chain data and historical models suggest that if Bitcoin were to break below the $60,000 threshold, recovery to its all-time high could be pushed back beyond Q2 2027.
Drawdown Depth Extends the Recovery Timeline
Ecoinometrics data shows a clear correlation between drawdown depth and recovery duration. Each additional 10% decline has historically added approximately 80 days to the time required to reclaim prior highs. At the current 48% drawdown from the October 2025 peak of $126,000, the full recovery cycle is estimated at nearly 300 days from the cycle peak.
Approximately 172 days have already passed, leaving about 125 to 130 days remaining if the cycle low was already confirmed at $60,000. However, cycle lows may not have been tagged yet, with BTC potentially facing further downside in the coming weeks.
The Bitcoin Combined Market Index (BCMI), which combines market-value to realized-value (MVRV), net unrealized profit/loss (NUPL), spent output profit ratio (SOPR), and market sentiment, currently sits around 0.27. This level is notably above the 0.15 threshold that has marked cycle bottoms in every major downturn since 2018.
In the 2018 cycle, BCMI reached 0.15 as Bitcoin fell to $3,100 from its $20,000 peak. In 2020, the index dropped to 0.147 when the price was $5,100. Similarly, in November 2022, BCMI fell to 0.12 as BTC formed its cycle lows at $15,880. With the index still elevated relative to historical bottom zones, a move toward 0.15 in 2026 likely requires further downside in BTC’s price.
Deeper Lows Push Recovery Window to Q2 2027
Crypto trader Ardi noted that whale delta versus retail delta reached its most aggressive sell level at -22.13 since October 2024. The chart illustrates BTC price breaking below a rising trendline, while underlying flows show consistent distribution from larger participants. Ardi stated: « Larger players are selling into this structure harder than they have in 18 months. That does not mean price has to collapse immediately. But it does mean this level is being tested with real sell pressure pressing into it. »
From a liquidity standpoint, CMCC Crest managing partner Willy Woo outlined similar weakness for BTC’s price. Woo accurately mapped out last month that BTC would rebound to the mid-$70,000 region in March, before aligning with the bearish trend as « the broader regime is heavily bearish with both spot and futures liquidity deteriorating. » From a cycle perspective, Woo expects a deeper reset before a confirmed bottom forms. Woo identified the $40,000–$45,000 range as a typical bear market floor, with timing skewed toward Q4 for the end of the bearish phase. This framework places the return of stronger bullish momentum into early 2027.
The Worst-Case Scenario: Toward $40,000?
If Bitcoin extends its decline toward the $40,000–$45,000 range, the drawdown from the $126,000 peak deepens to roughly 64–68% from all-time highs. Based on Ecoinometrics’ model, the additional downside significantly stretches the recovery timeline. At a 60%+ drawdown, the total recovery period historically expands to around 440 days from the cycle peak. In this scenario, a potential reclaim of the prior all-time high is expected sometime after Q2 2027.
These timelines are based on historical drawdown patterns and do not constitute predictions. Current macroeconomic conditions may alter the recovery path. The Kobeissi Letter noted that rate cuts are now expected only by December 2027, with a 51% chance of a rate hike by March 2027. This unexpected development may impact Bitcoin’s recovery pace relative to past cycles.
What Caused the 2026 Crash
Bitcoin’s 2026 crash was caused by four converging factors. First, the nomination of a hawkish Federal Reserve Chair in January 2026 triggered a risk-off selloff. Second, over $12 billion in U.S. spot Bitcoin ETF net outflows between November 2025 and January 2026 removed the primary institutional buying pressure. Third, a $19 billion forced liquidation cascade in October 2025 permanently damaged market liquidity. Fourth, aggressive profit-taking by long-term holders who distributed 3.67 million BTC near the $100,000–$126,000 range — larger than any previous cycle.
On-chain data from Glassnode confirms Bitcoin is in deep bear market territory, with the asset having crashed from $110K to $60K. Long-term holders realized 3.67 million BTC in profits — a distribution volume significantly larger than in previous cycles.
Three Scenarios for the Market Bottom
Analysts break down the potential decline into three distinct scenarios. A normal bear market scenario targets a 60–70% correction from the peak, typical of post-peak bear markets. An extended risk-off phase would see a 70–77% decline due to prolonged liquidity withdrawal. Finally, a low-probability systemic shock would involve widespread forced selling with an 85–90% correction.
ZX Squared Capital founder CK Zheng stated that Bitcoin is firmly in the deepest phase of the bear market and could fall another 30% in 2026. « The four-year crypto cycle momentum is gaining strength and is extremely difficult to break due to individual investors’ psychological behaviors, » he explained.
Signals That Could Indicate a Bottom
Despite the bearish setup, some indicators suggest a bottom may be forming. Long-term holder supply has started to increase again after months of distribution — meaning the generation of sellers who distributed at $100,000–$126,000 has largely completed its selling, and new long-term holders are beginning to accumulate at current prices.
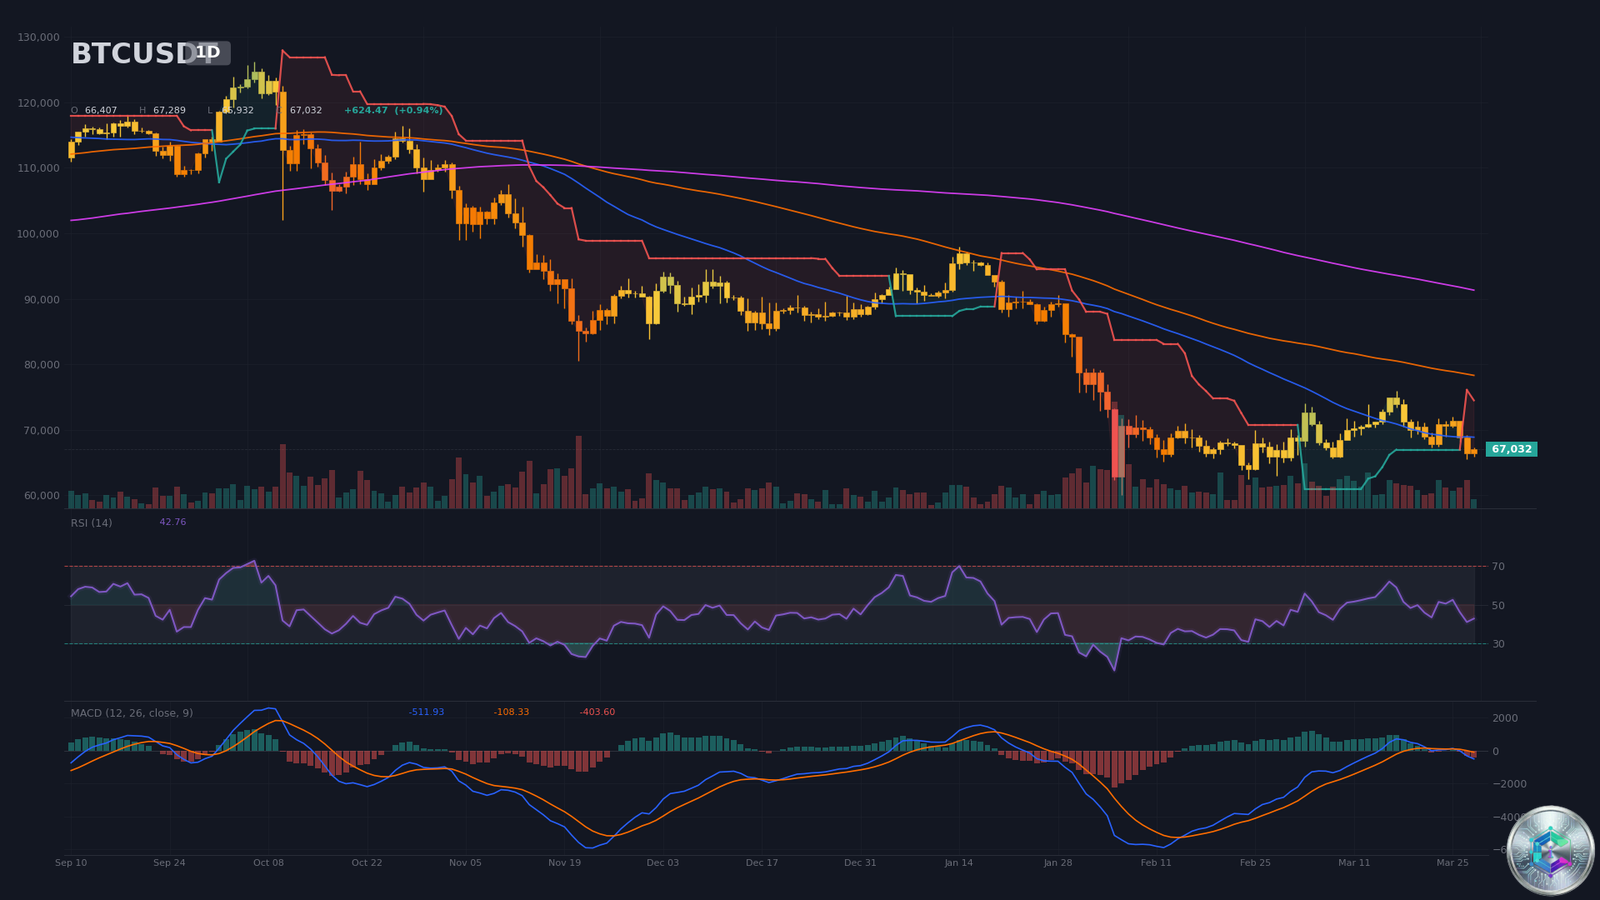
Additionally, institutional Bitcoin ETFs may offer a safety net absent during previous crashes. Bitcoin’s rebound from the February low of $60,000 to the current ~$67,000 suggests that some of the selling has been absorbed by buyers at these levels.
Implications for Investors
For investors holding Bitcoin, the current situation calls for both caution and patience. History shows that Bitcoin has always recovered from every crash, but the duration of recovery varies significantly. With spot Bitcoin ETFs offering a more accessible investment structure than in 2018 or 2022, some analysts believe the bottom could form faster than in previous cycles.
The classic « buy the dip » strategy requires particular attention to timing risk in the current environment. Data suggests that entering too early could mean enduring significant volatility before seeing a return above the purchase price. A dollar-cost averaging approach seems particularly suited to the current environment.
It is also essential to consider the broader macroeconomic context. Expectations of rate hikes by March 2027 and a contracting liquidity environment constitute significant headwinds for risk assets like Bitcoin. Investors must evaluate their risk tolerance accordingly.
Conclusion
Bitcoin stands at a crossroads in its market cycle. On-chain data, historical models, and technical indicators all point toward an extended period of bearish consolidation or further decline. If the $60,000 threshold were to give way, the recovery window to all-time highs could be pushed back beyond Q2 2027.
However, Bitcoin’s history is littered with examples where bearish expectations proved too pessimistic. New long-term holders accumulating at current levels could well be the winners of the next bull cycle. As always in the cryptocurrency space, caution and diversification remain essential.
Sources: Cointelegraph, Ecoinometrics, CryptoQuant, Willy Woo, ZX Squared Capital, Glassnode, CoinDesk, The Kobeissi Letter