
Introduction: A Pivotal Day for Bitcoin
On this critical date of March 27, 2026, the digital asset ecosystem finds itself at the confluence of multiple market forces of historic intensity. Bitcoin (BTC/USD), the undisputed leader of the cryptosphere, is navigating extreme turbulence — caught between restrictive macroeconomic headwinds, a major geopolitical crisis in the Middle East, and an unprecedented mechanics tied to the massive expiration of derivative contracts.
Having suffered a substantial correction from its all-time highs of October 2025, the current configuration demands a meticulous deconstruction of capital flows, investor psychology, and order book dynamics. This comprehensive analysis integrates the macroeconomic fundamental approach, liquidation flow analysis, order book mapping, and an in-depth chartist exploration across multiple timeframes (15-minute, 4-hour, and daily).
🌍 Macroeconomic Context: Geopolitics and Inflation
The Middle East Conflict: Epicenter of Tensions
The predominant catalyst for current risk aversion lies in the military escalation involving the United States, Israel, and Iran. The asymmetric closure of the Strait of Hormuz — a vital artery through which approximately one-fifth of global oil and LNG consumption transits — has sent shockwaves through global energy supply chains.
A last-minute diplomatic development temporarily altered market trajectory: President Donald Trump announced a 10-day extension of the ultimatum regarding potential strikes on Iranian energy infrastructure, pushing the deadline to April 6, 2026. This tactical pause triggered an immediate but precarious relief rally. Brent crude, which had breached $110/barrel, entered a correction phase, temporarily easing inflationary pressure.
For Bitcoin, this bipolar dynamic demonstrated genuine safe-haven properties during the initial phases of the conflict — even outperforming gold and silver, which suffered massive ETF outflows — while persistent uncertainty continues to cap long-term institutional commitment.
The Fed in Stagflation Mode: « Higher for Longer »
The direct corollary of the energy shock is the exacerbation of inflationary pressures. The February Core PCE — the Federal Reserve’s preferred inflation gauge — registered a monthly increase of +0.4% (vs +0.3% consensus), reaching 2.8% year-over-year. CPI remains anchored at 2.4% annually, buoyed by the energy price rebound.
The Fed maintains its restrictive target range of 3.50%–3.75%, with a revised « dot plot » now indicating only one potential rate cut for 2026. The « higher for longer » orthodoxy acts as a powerful brake on high-beta assets — Bitcoin’s correlation with the Nasdaq 100 has tightened to 0.78, meaning risk-off sentiment in growth equities mechanically spills over into crypto markets.
| Date | Event | Anticipated BTC Impact |
|---|---|---|
| Mar 27 | Deribit Quarterly Options Expiry (~$14.16B) | Extreme — gamma release |
| Mar 27 | SEC Verdict on 91 Crypto ETF Filings | Major binary — institutional sentiment |
| Mar 28 | Core PCE February (2.8% YoY) | Fed rate expectations revision |
| Apr 3 | Non-Farm Payrolls (NFP) | US recession risk assessment |
| Apr 6 | US-Iran Ultimatum Deadline | Systemic energy/inflation risk |
⚡ Market Microstructure: The Colossal March 27 Options Expiry
What makes this date particularly critical is the quarterly expiration of $14.16 billion in notional value of Bitcoin options on Deribit — erasing approximately 40% of the exchange’s total open interest in a single session. Including ~$3 billion in Ethereum options, over $17 billion in contracts settle simultaneously.
Max Pain at $75,000: The Market’s Gravitational Pull
The Max Pain level — the strike price at which the maximum number of options expire worthless, maximizing losses for premium buyers and optimizing profits for market makers — is anchored at $75,000. The « Gamma Pinning » phenomenon forces market makers into dynamic delta-hedging adjustments, compressing volatility and magnetically attracting prices toward this level in the hours preceding expiry.
Extreme Sentiment: Put/Call Ratio at Highest Since 2021
The Put/Call ratio has reached a remarkable peak of 0.84 — the highest level recorded since the June 2021 crash triggered by China’s mining ban. Premiums paid for put options have reached historic levels (approximately 4 basis points relative to spot volume), illustrating that institutions are willing to pay exorbitant sums to hedge against extreme tail risk.
The open interest distribution reveals a striking asymmetry: massive Put concentration between $60,000 and $80,000, while Calls are stacked in speculative zones between $100,000 and $220,000 — suggesting institutions are using downside hedging strategies while generating yield by selling deep out-of-the-money calls.
The Gamma Release: The Post-Expiry Detonator
The critical aspect is not the expiration itself, but the shockwave that follows. Once the clock passes 08:00 UTC, hedging obligations linked to these billions in contracts vanish instantaneously. This « Gamma Release » removes the algorithmic forces that were artificially compressing price action. Historically, Bitcoin tends to register directional moves exceeding 5% within 48–72 hours following major quarterly expirations.
🔗 On-Chain Analysis: Whale Resilience
Despite short-term bearish pressure, fundamental on-chain analysis reveals remarkable underlying resilience. Whales (addresses holding 10–10,000 BTC) have resumed accumulation and now control 68.17% of the total circulating supply — signaling a concentration of the asset in institutionally-minded long-conviction hands.
Bitcoin reserves on centralized exchanges have hit their lowest level in 7 years, falling below 2.7 million BTC — a structural reduction in liquid supply estimated at $52 billion. US spot Bitcoin ETF net flows remain positive despite geopolitical turbulence, confirming Bitcoin’s nascent maturity as an institutional portfolio diversification asset.
A notable data point: the mining cost of production currently sits at approximately $88,000 per Bitcoin at record hashrates. Spot prices below this threshold have historically represented an asymmetric accumulation zone for institutional investors.
🗺️ Liquidity Mapping: Order Book Heatmap
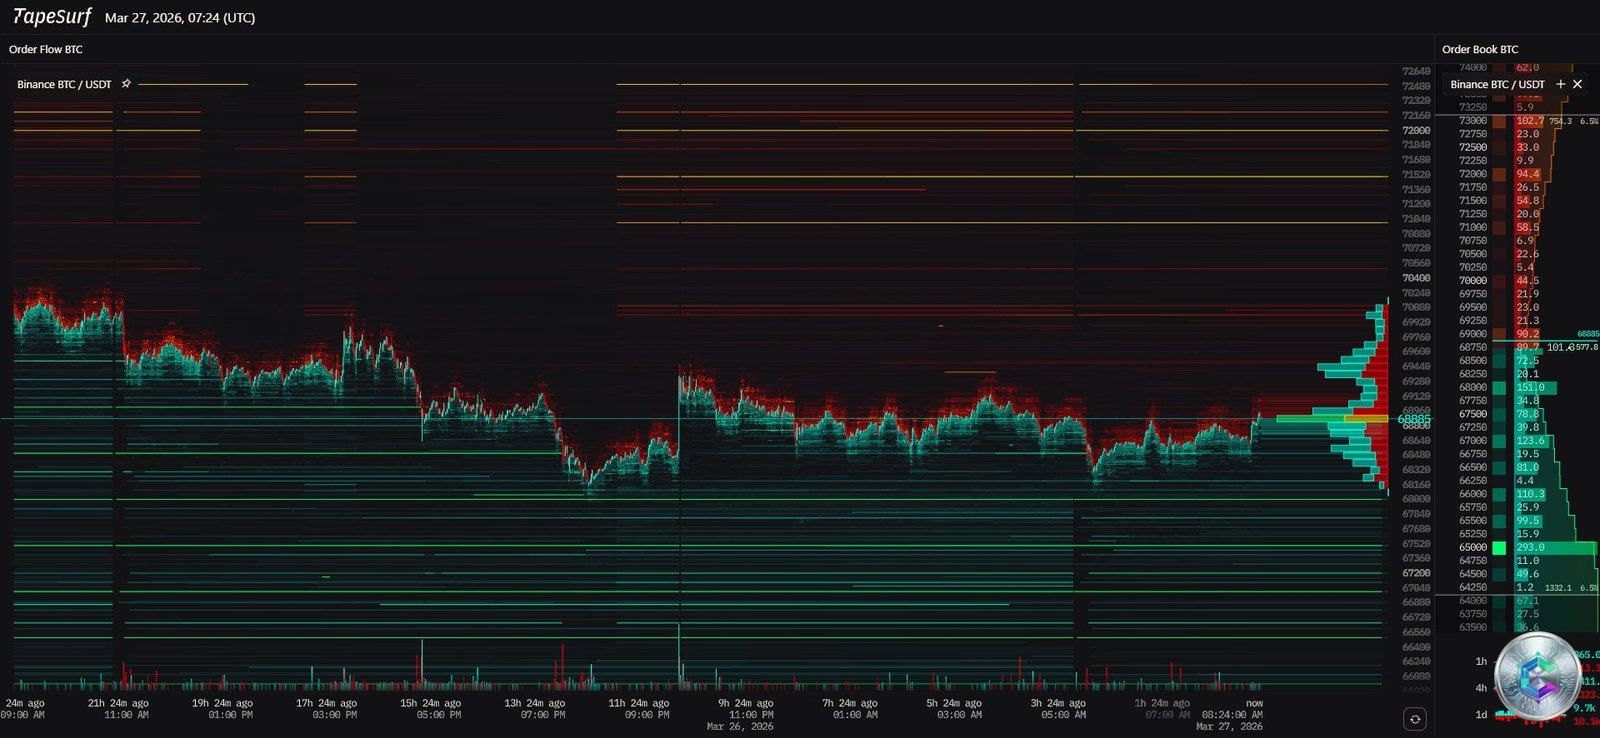
The liquidation heatmap precisely exposes the location of dormant liquidity:
- Upper Resistance Zone ($72,000–$80,000): Massive stacking of leveraged short positions and sell orders. This concentration acts as a « liquidity magnet » — a breakthrough here would trigger a cascade of forced short covers (Short Squeeze), propelling price vertically with minimal friction.
- Defensive Support Zone ($65,000–$68,000): Significant support bands representing the pain threshold for leveraged long positions. The market has a natural propensity to conduct « liquidity sweeps » — flushing out excessive positions before establishing a healthy base for a genuine bullish reversal.
📊 Multi-Timeframe Technical Analysis
Daily Chart: The Death Cross Threat
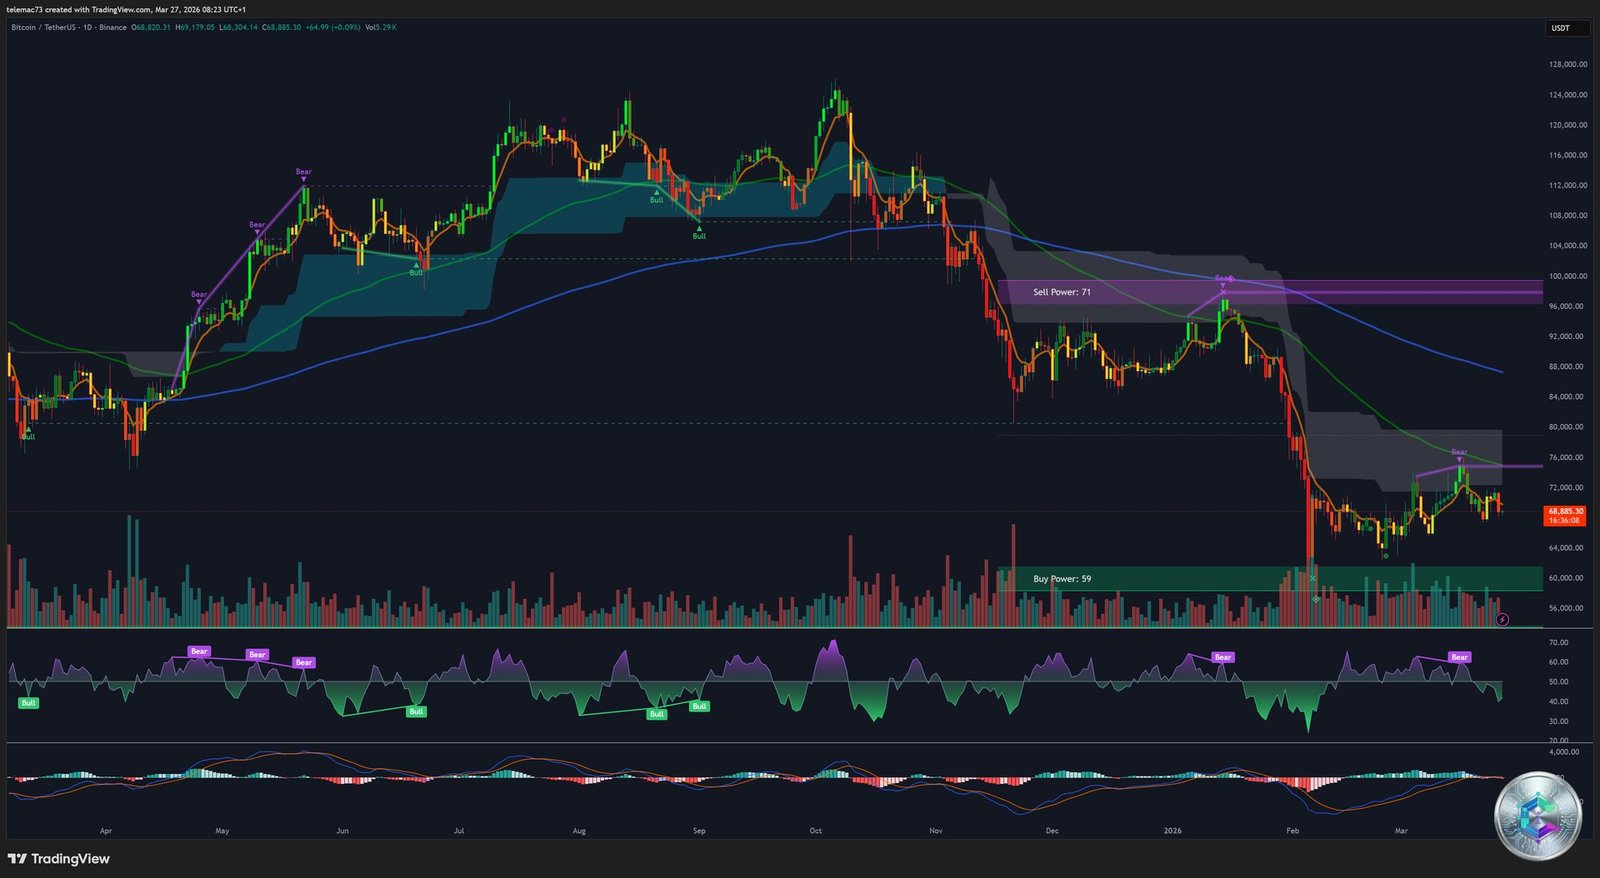
The daily chart presents a structure dominated by a prolonged correction from the October 2025 all-time highs. Price action is encapsulated beneath a major bearish trendline, defining a lower highs / lower lows structure characteristic of a formal bear market.
The most critical development: the imminent « Death Cross » — the MA50 (~$70,227) crossing below the MA200 (~$70,070), both having transitioned from dynamic supports to crushing overhead resistances. The technical signal matrix displays a « Strong Sell » consensus across 12 major moving averages.
- RSI (14-day): ~35–38, bearish zone without reaching extreme oversold territory (<30). Potential depreciation margin still exists before a mechanical capitulation signal.
- MACD (12,26): Solidly anchored in negative territory (~-425). Descending histogram bars below zero — bearish momentum not yet reversed.
- Fibonacci: Price struggling to hold the 0.236 retracement at $68,970. Loss of this level → bearish target: $59,764. Resistance at 0.382 ($74,664) aligns remarkably with the options Max Pain zone.
4-Hour Chart: Compression and Bear Flag
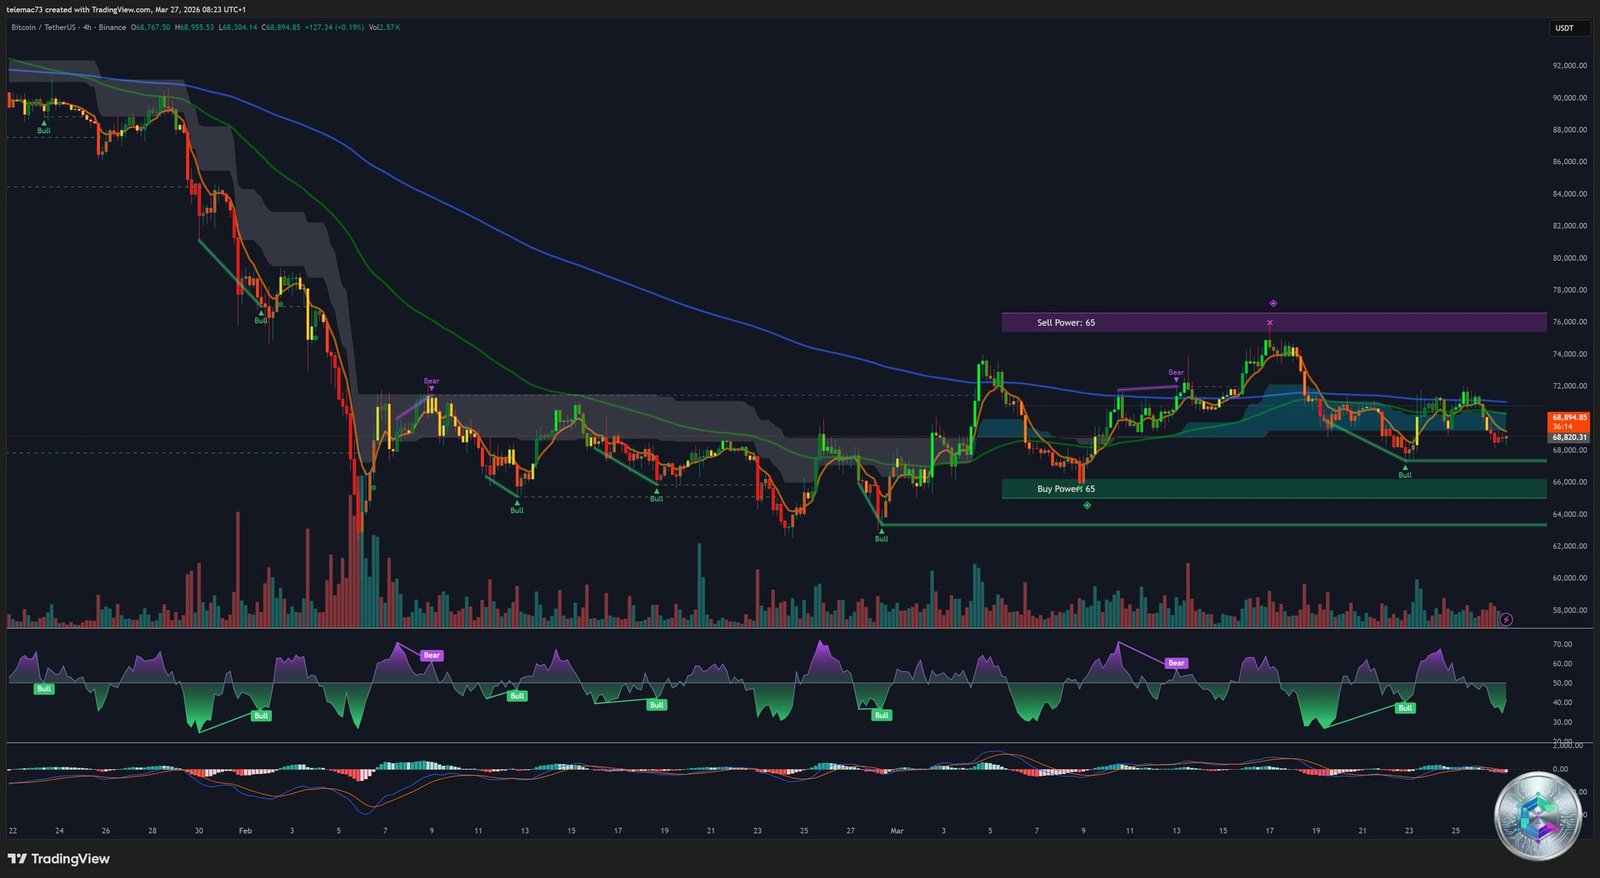
The 4H chart reveals highly compressed price action, characteristic of a market awaiting a major catalyst resolution. The candle structure traces a classic bear flag or asymmetric descending broadening wedge: a series of ascending lows repeatedly colliding with a rigid horizontal resistance at $71,500–$72,800.
The bulls’ inability to achieve decisive closes above this zone with volume expansion confirms an institutional preference to « sell into rallies » rather than support a breakout. The 4H RSI hovers near the 50 neutrality line — pure indecision. The 4H MACD shows repetitive crossovers with a flattened signal line near zero, typical of a market trapped in institutional smart money accumulation/distribution.
15-Minute Chart: Microstructure and Liquidity Sweeps
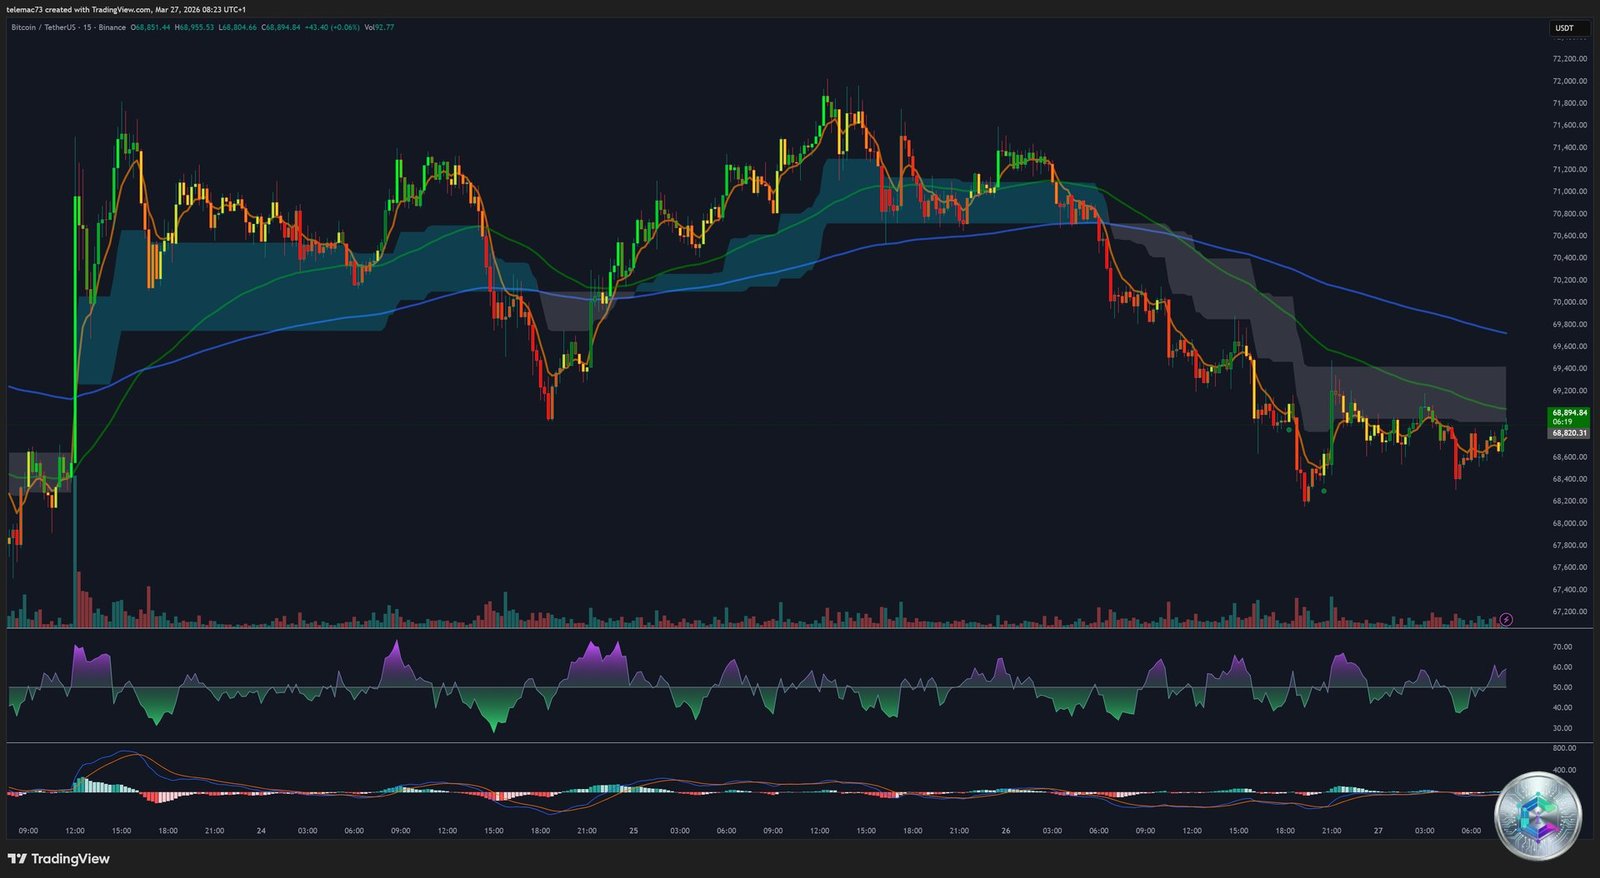
The intraday analysis exposes the brutality of market microstructure ahead of massive liquidity events like options expiry. The market executes rapid algorithmic moves — hunting stop-losses above local highs before abruptly reversing to clear stops below local lows. This « whipsaw » phenomenon generates intraday volatility expansion without underlying directional bias.
EMA 5 and 10 cross perpetually, generating false signals. On this timeframe, the RSI (oscillating rapidly between 20 and 80) and Stochastic (often pinned at 99, indicating instantaneous overbought) are primarily useful for identifying immediate momentum exhaustion during excursions beyond Bollinger Bands or key pivot levels — favoring mean reversion strategies for scalping operators.
🎯 Key Pivot Levels and Critical Zones
| Level | Price Zone | Role |
|---|---|---|
| S3 Critical | ~$67,596 | Extreme support — liquidity sweep zone |
| S2 Key | ~$68,013 | Major Fibonacci 0.236 support |
| Central Pivot | ~$68,914 | Pivotal inflection point — directional threshold |
| R1 Resistance | ~$69,398 | First bullish hurdle |
| R2 Key | ~$71,500–$72,800 | 4H glass ceiling — distribution zone |
| R3 Critical | ~$74,664–$75,000 | Fibonacci 0.382 + Options Max Pain |
🔮 Synthesis: Two Post-Expiry Scenarios
🟢 Bullish Scenario: Short Squeeze and Liberation
If international negotiations yield a tangible ceasefire in the Iran-US conflict, the inflationary narrative will immediately soften. The evaporation of open interest post-08:00 UTC will clear the path for institutional players who have continued aggressively accumulating on-chain and via ETFs. A volume-validated breakout above $72,800 will trigger the liquidation cascade targeted by the heatmap, propelling Bitcoin through the liquidity void toward the Fibonacci 0.500 retracement at $79,267.
🔴 Bearish Scenario: Capitulation and Liquidity Shock
Conversely, if NFP data or geopolitical deterioration (as the April 6 deadline looms) exacerbate the repressive monetary policy stance, the dominant bearish structure on the daily chart will reassert itself. The Death Cross will act as a self-fulfilling prophecy for algorithmic funds. Failure of the critical Fibonacci pivot at $68,970 will expose the market to a rapid flush of leveraged long positions concentrated between $65,000 and $68,000 on the heatmap, opening the path toward the structural and psychological floor at $60,000.
In either scenario, professional operators must calibrate position sizes in anticipation of a massive ATR (Average True Range) expansion in the coming days — using the identified confluence levels ($68,900 as pivot support, $72,800 as inflection resistance) as impartial arbiters of Bitcoin’s next trend regime.
⚠️ Disclaimer
This article is written exclusively for educational and informational purposes. It does not constitute investment advice, or a recommendation to buy or sell digital assets or any other financial instrument. Cryptocurrency markets are extremely volatile and carry significant risk of capital loss. CryptoInfo.ch disclaims all responsibility for financial decisions made based on the information presented in this article. Please consult a licensed financial advisor before making any investment decisions.