
Introduction: A Market at the Crossroads
On March 25, 2026, Bitcoin (BTC) is trading in a narrow consolidation range between $70,556 and $71,048, posting a roughly 3% gain over the past 24 hours. On the surface, these figures appear unremarkable. Beneath them lies an asset simultaneously weathering a macroeconomic storm, absorbing geopolitical shocks, and benefiting from a landmark regulatory overhaul — all at once.
The total crypto market capitalization stands at an impressive $2.51 trillion, with daily trading volume approaching $98.23 billion. Bitcoin maintains a commanding dominance of 56.52%, acting as the primary destination for institutional capital flows. Yet the Fear & Greed Index flashes an alarming score of 14 — « Extreme Fear ». This disconnect between price resilience and market sentiment is precisely what demands deeper analysis.
🌍 Macroeconomic Context: Geopolitics, the Fed, and BRICS
The US-Iran Military Pause: An Unexpected Catalyst
The immediate trigger for the current rally was the announcement of a temporary five-day military pause on strikes against Iran, following talks described as « productive. » Market reactions were swift: Brent crude fell 4%, gold corrected 13% — and Bitcoin climbed 3%.
This directional divergence reinforces an increasingly compelling thesis: Bitcoin is no longer merely a risk-on asset correlated to tech indices. It is evolving into a digital safe-haven, attracting capital seeking protection against fiat debasement while capturing the technology growth premium. The correlation coefficient between BTC and the DXY (US Dollar Index) has collapsed to near zero over the past 50 sessions — a mathematical decoupling that speaks for itself.
The Federal Reserve’s Continued Pressure
At the macro level, monetary policy remains the primary headwind. Following the March 19 FOMC meeting, markets now price in just one rate cut for all of 2026. The 10-year US Treasury yield has once again breached 4.3%, offering institutional investors a compelling risk-free return alternative. Despite this liquidity-tightening environment, Bitcoin holds above $70,000 — a remarkable display of relative strength.
The BRICS Initiative: A Long-Term Structural Catalyst
Beyond short-term dynamics, BRICS nations have formalized a digital clearing mechanism for local-currency transactions, designed to bypass the US dollar and the SWIFT network. While distinct from public cryptocurrencies, this protocol institutionally validates blockchain infrastructure at sovereign scale. The market immediately speculated on potential beneficiaries — Stellar (XLM) surging more than 7% in its wake.
| Macro Vector | Dynamics (March 2026) | Theoretical BTC Impact | Empirical Observation |
|---|---|---|---|
| US-Iran Tensions | 5-day ceasefire | Bearish (if correlated to gold) | +3% (safe-haven behavior) |
| US 10Y Yields | Above 4.3% | Selling pressure | Resilient consolidation |
| Fed Policy | Only 1 cut expected in 2026 | Liquidity contraction | Institutional absorption |
| Oil / Gold | -4% / -13% | Sector rotation | Capital flows redirect to BTC |
⚖️ Regulatory Revolution: March 2026, the Tipping Point
The SEC/CFTC Taxonomy: 16 Cryptos Classified as « Digital Commodities »
On March 17, 2026, the SEC and CFTC jointly released a landmark 68-page interpretive guidance — ending over a decade of regulation by enforcement. This foundational document establishes a five-category taxonomy and explicitly classifies 16 major cryptocurrencies as « digital commodities », permanently removing them from securities law jurisdiction.
The list includes: Bitcoin (BTC), Ethereum (ETH), Solana (SOL), XRP, Cardano (ADA), Avalanche (AVAX), Chainlink (LINK), Polkadot (DOT), Hedera (HBAR), Litecoin (LTC), Bitcoin Cash (BCH), Shiba Inu (SHIB), Stellar (XLM), Tezos (XTZ), Aptos (APT), and Dogecoin (DOGE).
The legal rationale rests on a revised interpretation of the Howey Test: for an asset to qualify as an investment contract (and therefore a security), the issuer must formally promise managerial efforts essential to the investor’s profit expectations. Digital commodities, by contrast, derive their value from the programmatic operation of a functioning cryptographic system and pure supply-demand dynamics. Proof-of-Work mining and staking are explicitly confirmed to not constitute securities offerings.
The impact is monumental: compliance committees at major financial institutions that had been blocking crypto allocation due to SEC litigation risk now have clear legal runway.
The CLARITY Act: The Stablecoin Yield Compromise
On March 20, 2026, Senators Thom Tillis and Angela Alsobrooks announced a bipartisan deal on the Digital Asset Market Clarity Act. The compromise bans purely passive stablecoin yields (analogous to bank deposit interest), while protecting activity-based reward models — liquidity provision, decentralized staking, DeFi protocol usage. Passage probability is now estimated at approximately 70%, with a committee markup scheduled for the second half of April 2026.
| Regulatory Event | Date | Decision | Market Impact |
|---|---|---|---|
| SEC/CFTC Taxonomy | March 17 | 16 cryptos = digital commodities | End of Howey legal risk |
| CLARITY Act (deal) | March 20 | Passive stablecoin yields banned | Banks protected, DeFi legitimized |
| Senate Hearings | March 23 | Lobby review underway | April vote (70% probability) |
🏢 Institutional Accumulation: Corporate Treasuries on the Offensive
The new legal clarity is acting as an accelerant for corporate treasury strategies. MicroStrategy acquired an additional 89,618 BTC in Q1 2026, backed by a $1.4 billion capital raise, bringing its total holdings to over 430,000 BTC. The contagion of this strategy has now spread to the AI sector: Hyperscale Data (NYSE: GPUS), specializing in AI data centers, holds 627.8970 BTC whose combined value represents approximately 147% of its market capitalization — a striking valuation dislocation.
🔬 Market Microstructure: The Order Book Heatmap
Before examining the price charts, understanding the order book microstructure is essential to identifying the gravitational forces acting on price.
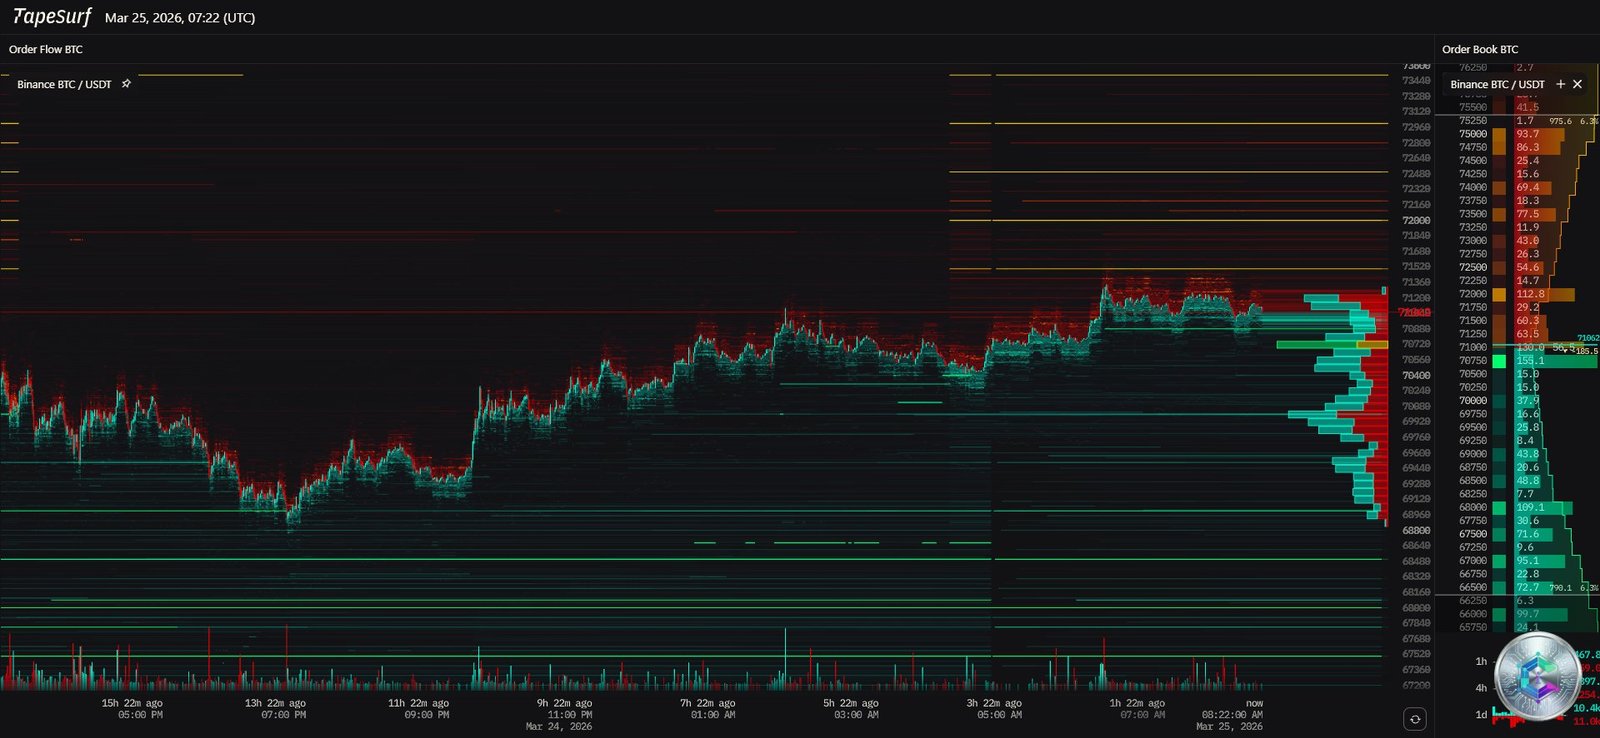
The heatmap reveals a deep tactical asymmetry around the current price (~$70,820):
- Sell Wall (Ask Liquidity): The $71,500–$73,000 zone is saturated with limit sell orders (bright red to crimson). This liquidity ceiling will require extraordinary buying pressure to absorb — but a break above would mechanically trigger a violent short squeeze.
- Institutional Safety Net (Bid Liquidity): The $68,000–$70,000 zone features a dense green buy wall. This floor has already proven its resilience during dips toward $67,300–$67,500.
The market is compressed in a liquidity vice. The decline in Open Interest below $22 billion confirms significant deleveraging. The next directional move will be driven by real Spot flows, not cascading liquidations.
📊 Multi-Timeframe Technical Analysis
Daily Chart (1D): The Reconstruction Phase
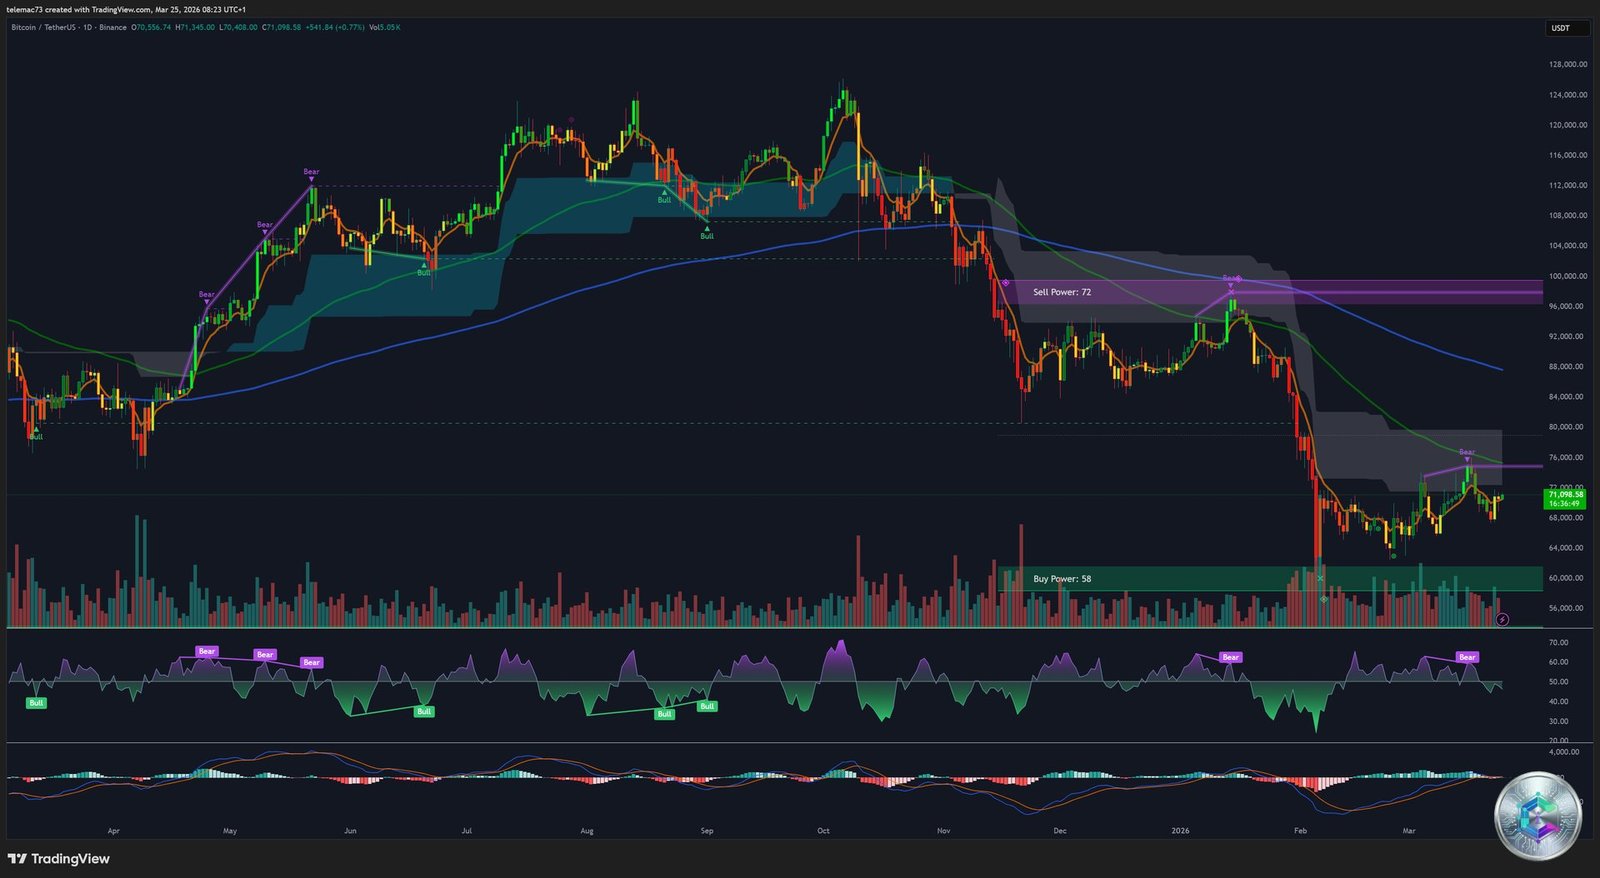
Bitcoin is in a reconstruction phase following a brutal correction from its October 2025 all-time high of $126,021 — a contraction of over 45% to the capitulation low of $58,793. Key technical reads:
- Ichimoku (Kumo): Price collapsed below the cloud during the selloff. The projected Kumo remains red (macro bearish dominance), but price is now attempting to penetrate the lower boundary (Senkou Span A) — a zone of extreme turbulence signaling a potential regime change.
- Fibonacci: The critical pivot at 0.236 sits at $68,227. BTC’s ability to hold this level as support validates a market structure shift (MSS) thesis, invalidating the « dead cat bounce » narrative.
- MACD: Bullish crossover (Golden Cross) in negative territory with growing green histogram bars — accelerating buy-side momentum.
- RSI: Recovered from extreme oversold levels, now navigating a neutral-bullish zone (50–60), leaving substantial room before overheating.
| Fibonacci Level | Price ($) | Significance |
|---|---|---|
| Support Pivot (0.236) | $68,227 | Recovery/Breakdown boundary |
| Intermediate Resistance (0.382) | $74,064 | Next major liquidity obstacle |
| Range Midpoint (0.5) | $78,781 | Midpoint of total correction |
| Golden Pocket (0.618) | $83,479 | Ultimate structural resistance |
| Long-Term Extension (1.618) | $123,474 | Prior ATH retest zone |
4-Hour Chart (4H): The Compression Triangle
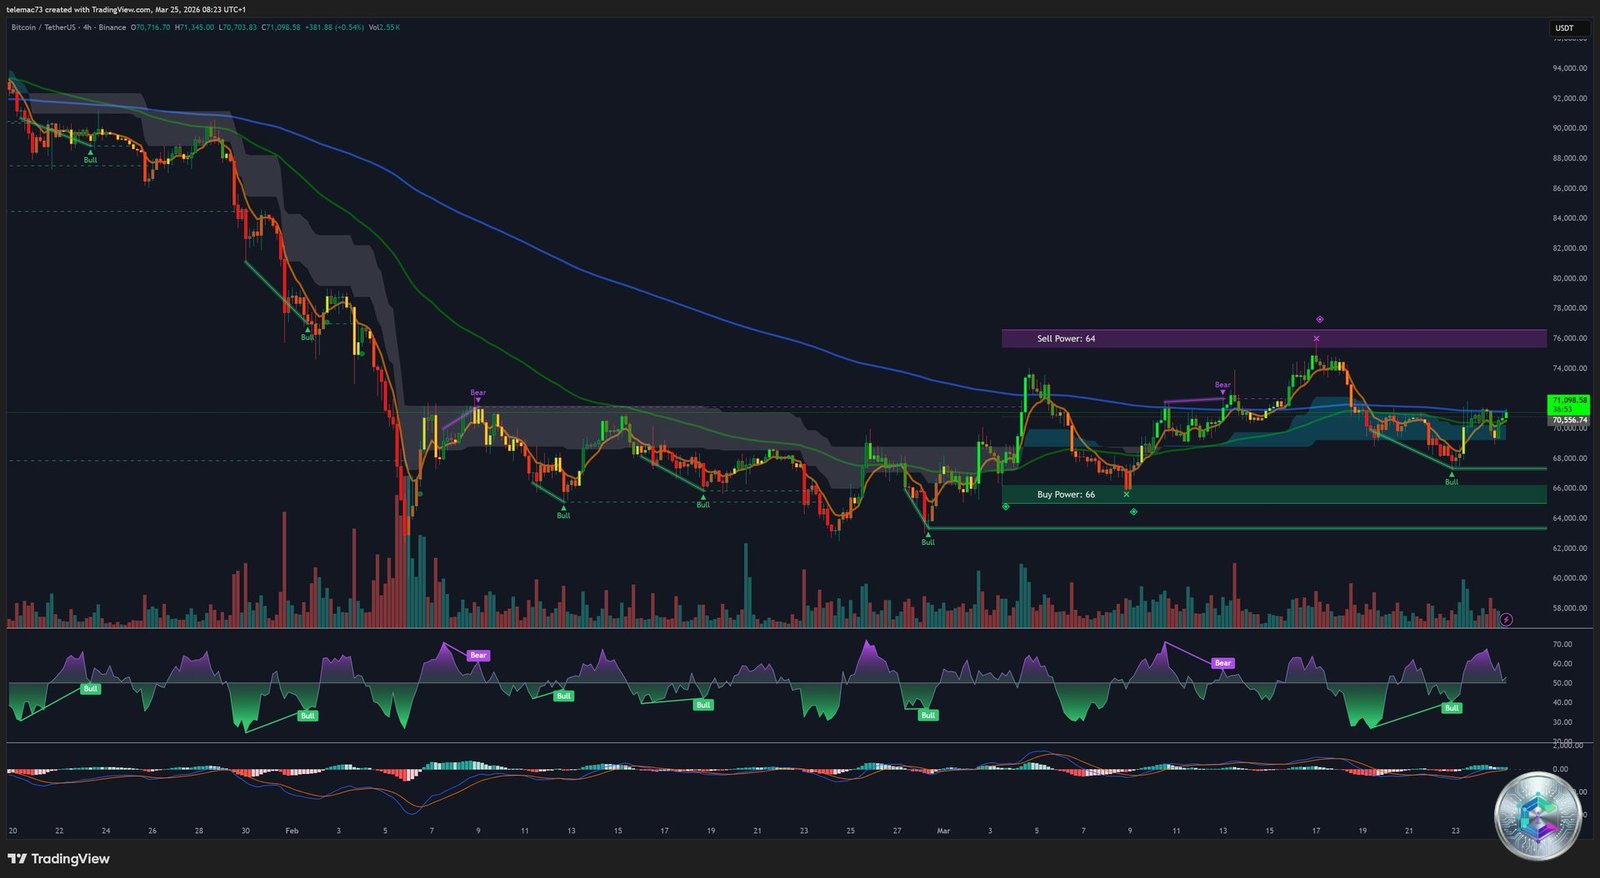
On the 4H timeframe, price action is carving out a large symmetrical compression triangle. Late-March dynamics show a breakout attempt to the upside — and unlike the daily chart, price is now trading inside the Ichimoku cloud, one step away from an emergence that would canonically validate a bullish regime change.
An imminent EMA 50/200 Golden Cross on this timeframe would serve as an algorithmic trigger for quantitative funds, generating a wave of automated buy orders. However, the 4H MACD shows signs of fatigue (shrinking green histogram bars) — a healthy digestion phase before an assault on the $72,000 glass ceiling.
15-Minute Chart (15M): Anatomy of a Short Squeeze
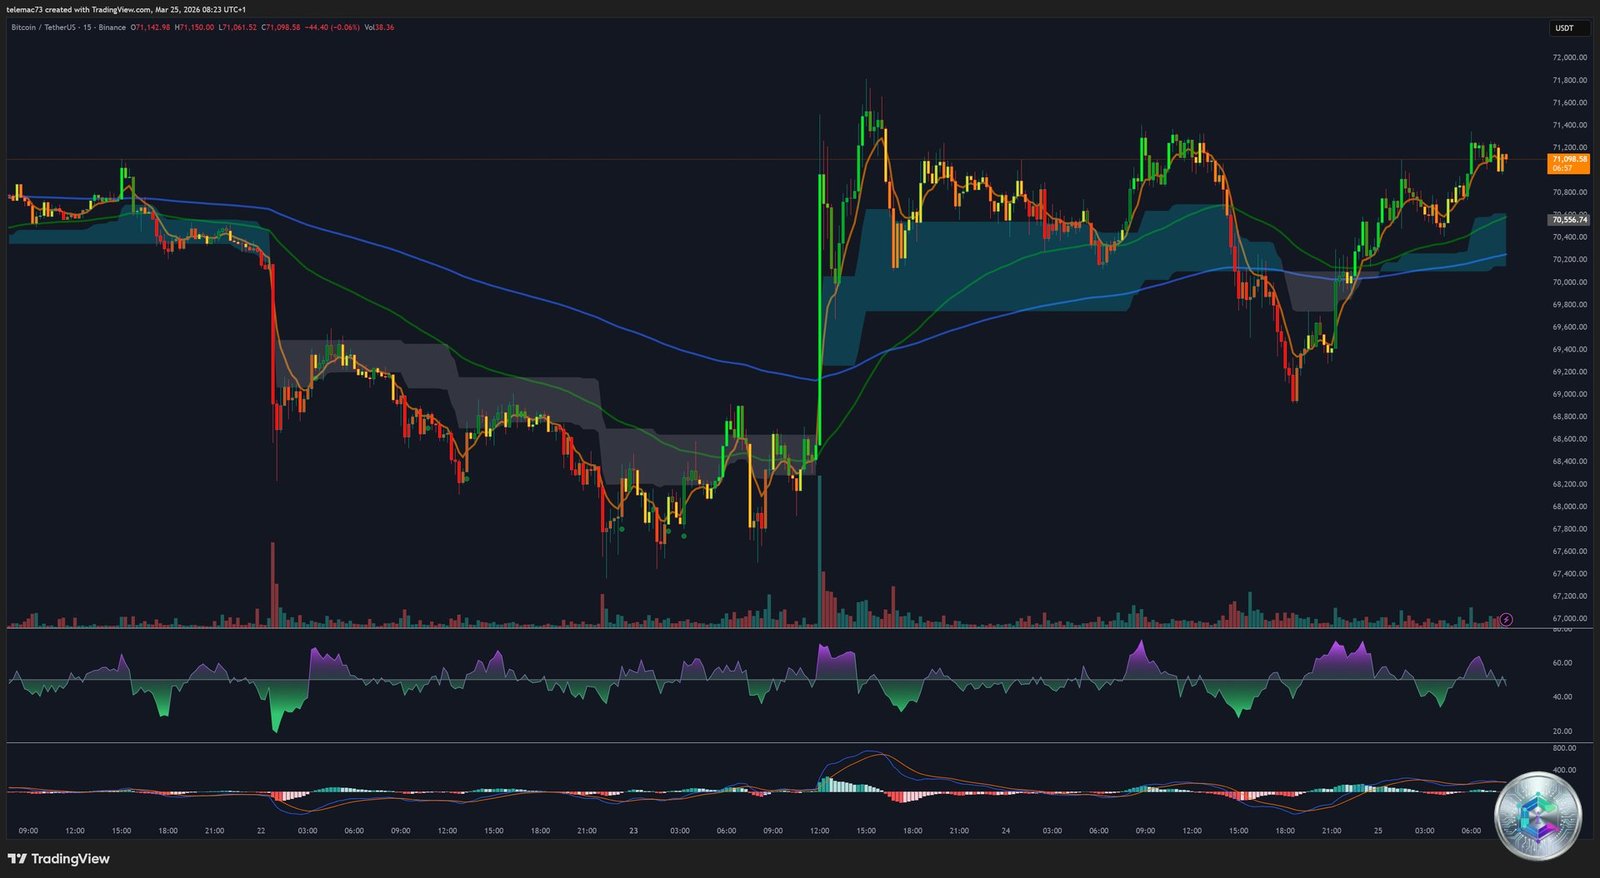
The 15M chart reveals the precise mechanics of the recent move. The near-vertical impulse candle is not organic buying — it is the unmistakable signature of a short squeeze: the ceasefire announcement triggered stop-loss orders among short sellers, liquidating over $269 million in bearish positions within hours.
Following this explosion, price consolidated into a textbook bull flag — a healthy digestion pattern that, as long as the $69,500 support holds, points toward bullish continuation. The 15M RSI has elegantly reset to 50 (a perfect thermal reset), while the current bearish MACD cross is failing to push price meaningfully lower — confirming that selling pressure is dissipating momentum, not reversing the trend.
🔄 Sector Rotation: Altcoins in the Spotlight
BTC stabilization above $70,000 is unlocking liquidity for altcoin speculation, but the rotation is selective and narrative-driven:
- Stellar (XLM) +6.28% to +8.48%: The primary BRICS beneficiary — architecturally built for fast, low-cost sovereign cross-border payments.
- Cardano (ADA) +3%: Lifted by its digital commodity classification and layer-1 fundamentals.
- Bittensor (TAO) +10.19%: The AI/crypto narrative remains a powerful driver. Real-world asset (RWA) tokenization surged +245% year-over-year.
- Ethereum (ETH) ~$2,132–$2,164: Strong on-chain fundamentals (37M ETH staked, only 16.2M ETH liquid on exchanges), despite net ETF outflows. The SEC’s staking clarification should accelerate the supply shock.
- Solana (SOL): Classified as a digital commodity, attracting institutional interest ahead of a probable Spot ETF approval.
🎯 Strategic Synthesis: Critical Levels and Scenarios
The central paradox — price resilient above $70,000 with Fear & Greed at 14 — is actually the hallmark of a market participant substitution: retail investors are capitulating under macroeconomic anxiety, while institutional entities accumulate discreetly in the Spot market, armed with their newly gained legal clarity. The market is climbing a classic « wall of worry » — historically the precursor to the most durable bull markets, built on structural conviction rather than fragile leveraged speculation.
Bullish Scenario ✅
A confirmed daily close above $72,000 would trigger a cascade of short covering, mechanically pushing price toward:
- $74,064 (Fib 0.382)
- $78,781 (Fib 0.5)
- $83,479 (Golden Pocket Fib 0.618)
Bearish Scenario ⚠️
If bond yields choke global risk appetite, a retest of the $68,227 pivot (Fib 0.236) becomes probable. A confirmed breakdown would expose the $64,400 level. Nevertheless, the order book architecture — heavily weighted with institutional bids below $68,000 — suggests corrections will be treated as generational accumulation opportunities.
🔑 Conclusion
March 2026 will be remembered as a historic inflection point for Bitcoin and the broader crypto ecosystem. The convergence of unprecedented regulatory clarity (SEC/CFTC + CLARITY Act), structural institutional accumulation, a decoupling from the gold/BTC correlation, and a market microstructure in active deleveraging paints the picture of an asset on the threshold of a new era of financial legitimacy. The coming weeks will be decisive: the resolution of the 4H compression triangle and the battle for $72,000 will define the trajectory for the next quarter.
⚠️ Disclaimer
This article is written for educational and informational purposes only. It does not constitute investment advice or a recommendation to buy or sell any digital asset. Cryptocurrency markets are highly volatile and speculative. Investing carries the risk of capital loss. Please consult a qualified financial advisor before making any investment decisions.