
A Macroeconomic Context of Rare Complexity
Bitcoin’s price trajectory at the end of March 2026 unfolds against a backdrop of rare analytical complexity, where diverging macroeconomic forces, exceptionally acute geopolitical tensions, and an internal market structure dominated by institutional hyper-financialization converge. This report synthesizes these dynamics through the lens of multi-timeframe chart analysis, derivatives market study, and on-chain fundamentals evaluation, to provide a precise mapping of the asset’s directional probabilities.
The Geopolitical Shock and Risk Repricing
Bitcoin’s recent trajectory has been intimately dictated by the escalation — and then sudden de-escalation — of military tensions in the Middle East. The announcement of a five-day pause on planned US military strikes against Iranian energy infrastructure sent an immediate shockwave through every global asset class. This political decision, officially motivated by talks described as « productive » by President Donald Trump, instantaneously reversed market psychology, triggering a lightning-fast transition from a risk-off regime to a strong risk-on posture.
The repercussions on traditional markets were remarkably brutal: S&P 500 futures surged by nearly 3%, while crude oil prices (Brent and WTI) suffered a violent contraction of 7% to 11%. Amid this macroeconomic turmoil, Bitcoin demonstrated exceptional structural resilience: within a few hours, the asset surged more than 4.8%, climbing from lows around $67,300 to briefly breach the $71,800 mark.
This relative decorrelation from physical gold — which suffered heavy profit-taking — suggests a profound mutation in institutional perception of Bitcoin. The asset is beginning to capture a liquidity premium as a non-sovereign store of value operating continuously, capable of absorbing macroeconomic shocks outside the strict opening hours of traditional financial markets.
Nevertheless, the Federal Reserve maintains a relentless restrictive policy stance, with interest rates in the 3.50%–3.75% range and a decidedly hawkish dot plot potentially forecasting only a single rate cut for all of 2026. The market is thus navigating a narrow corridor, caught between relief over a temporarily averted regional war and the hard reality of persistent quantitative tightening.
Institutional Flows, Spot ETFs and Regulatory Clarity
Bitcoin’s market microstructure has been irrevocably altered by the continuous and systematic absorption of circulating supply by US-based spot Bitcoin ETFs. Despite the ambient geopolitical volatility and interest rate uncertainties, these traditional finance vehicles recorded a remarkable four consecutive weeks of net inflows, totaling approximately $2 billion. BlackRock’s iShares Bitcoin Trust (IBIT) has established itself as the dominant liquidity vacuum in the ecosystem, capturing nearly $1.7 billion of those inflows alone.
In parallel, MicroStrategy unveiled a monumental financing plan to raise an additional $42 billion to accelerate Bitcoin purchases. With a treasury already exceeding 762,000 BTC, the company acts as a financial black hole for circulating supply, sending a strong conviction signal to the rest of the institutional market.
On the regulatory front, the SEC and CFTC reached a decisive milestone by jointly classifying approximately fifteen major cryptocurrencies — including Bitcoin, Ethereum, Solana, and XRP — as digital commodities rather than securities. This regulatory clarity drastically lowers the barrier to entry for pension funds, university endowments, and major asset managers, fueling the probability of a prolonged institutional accumulation super-cycle.
Network Fundamentals: The End of Miner Capitulation
The mining industry had been traversing a zone of extreme turbulence: the average cost of producing a single Bitcoin had climbed into a prohibitive range of $74,000 to $87,000, making mining unprofitable for the vast majority of operators. However, the recent upward crossover of the 30-day hashrate moving average above the 60-day average officially certifies the end of miner capitulation — a historically reliable on-chain buy signal materialized by the Hash Ribbons indicator.
Historically, this signal has systematically preceded Bitcoin’s most sustained bullish expansion phases (observed in 2015, 2019, and late 2022). In parallel, companies like Riot Platforms are orchestrating a massive strategic pivot toward AI and high-performance computing data centers, structurally reducing potential selling pressure during future bear cycles.
Derivatives Architecture: The March 27 Quarterly Expiry
The absolute attention of the financial ecosystem is focused on the massive quarterly options expiry set for Friday, March 27, 2026. On the dominant platform Deribit, open interest for the March expiration reached historic highs, with estimates ranging from $8.27 billion to over $9.5 billion in notional assets set to expire.
The distribution of strike prices reveals an asymmetric positioning that reflects the market’s schizophrenia. Call options (betting on a rise) are heavily concentrated around the $100,000 psychological threshold, while put options cluster massively in the $65,000 to $80,000 range, illustrating an urgent institutional hedging need. The 25-delta skew has widened sharply to 15% to 20% in favor of puts, with the put/call ratio reaching a cyclical high of 0.77.
The mathematical concept of Max Pain — the price level at which the cumulative intrinsic value of all expiring options is minimized — oscillates between $70,000 (near-term contracts) and $90,000 (macro contracts). The iron law of gamma hedging should compress directional volatility as the March 27 deadline approaches, before a violent energy release once the expiry is past. Perpetual funding rates have also cooled considerably, falling from unsustainable levels of 4.1% to a healthier annualized average of approximately 2.7%, creating a structurally sounder foundation for a potential future ascent.
Heatmap Analysis and Order Flow
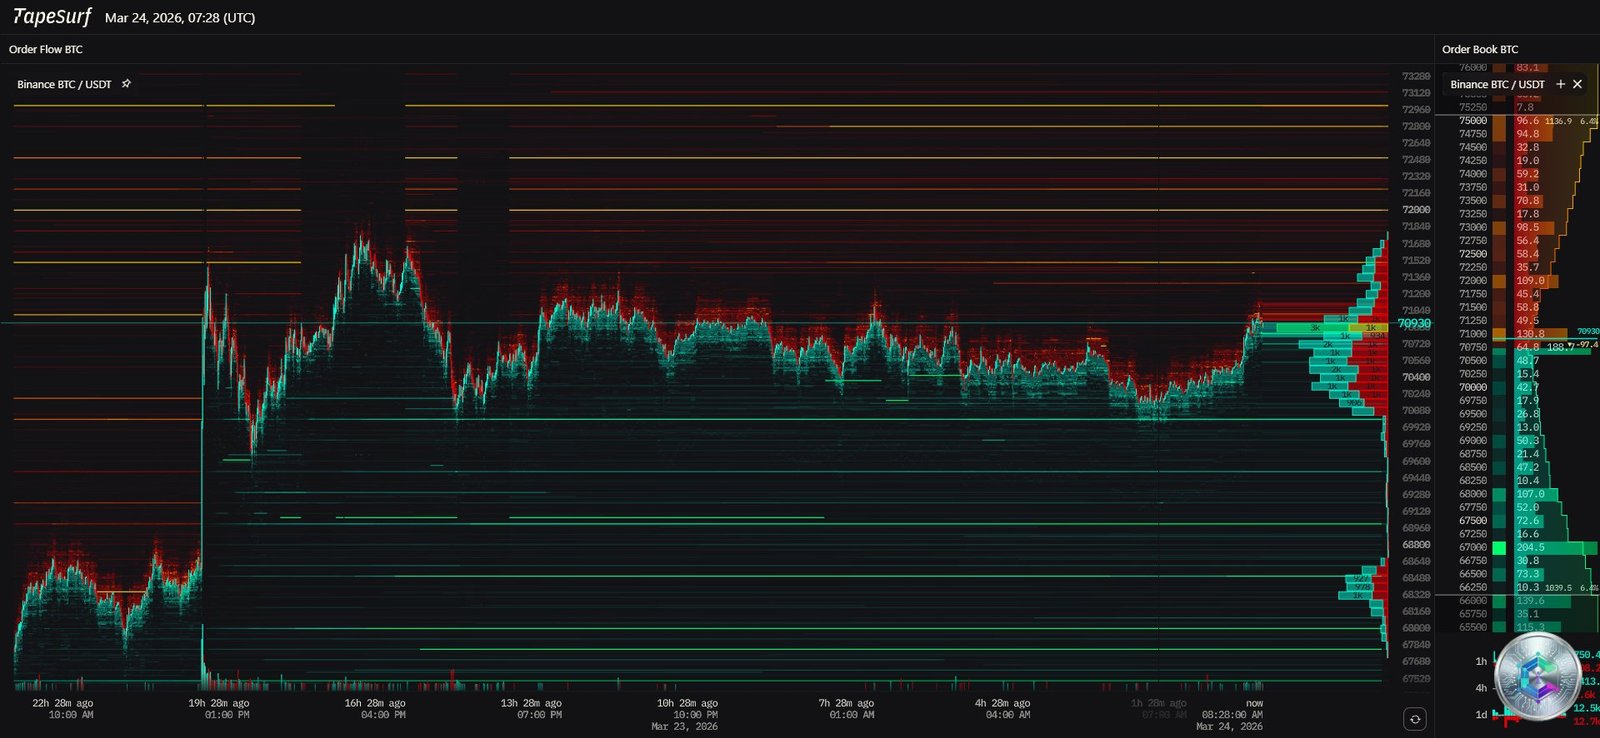
The TapeSurf interface displaying order flow and liquidity heatmap for Bitcoin/USDT on Binance offers a surgical X-ray of the current market microstructure. The spot price is anchored at $70,930, at the heart of a deeply asymmetric order book architecture.
To the upside: a dense series of bright yellow and red bands stacks menacingly between $72,000 and $75,250, representing massive concentrations of limit sell orders. The intensity of the yellow color around $74,000–$75,000 signals a major resistance zone doubled by a gamma wall tied to the options market. A clean break above $75,250 would mechanically trigger stop-loss orders from short sellers, potentially propelling the price toward $78,000 within hours via a short squeeze.
To the downside: the zone below $70,930 presents a radically different topography — cold-colored bands (green/blue) descending toward $69,000, $68,000, and $67,000, signaling a scarcity of limit buy liquidity. The volume profile thins considerably below the current Point of Control ($70,500–$71,000), forming a Low Volume Node (LVN) that could accelerate a free-fall toward the critical support zone at $66,000–$67,000 in the event of a breakdown.
Multi-Timeframe Chart Analysis
Daily Chart — The Battle of the Moving Averages
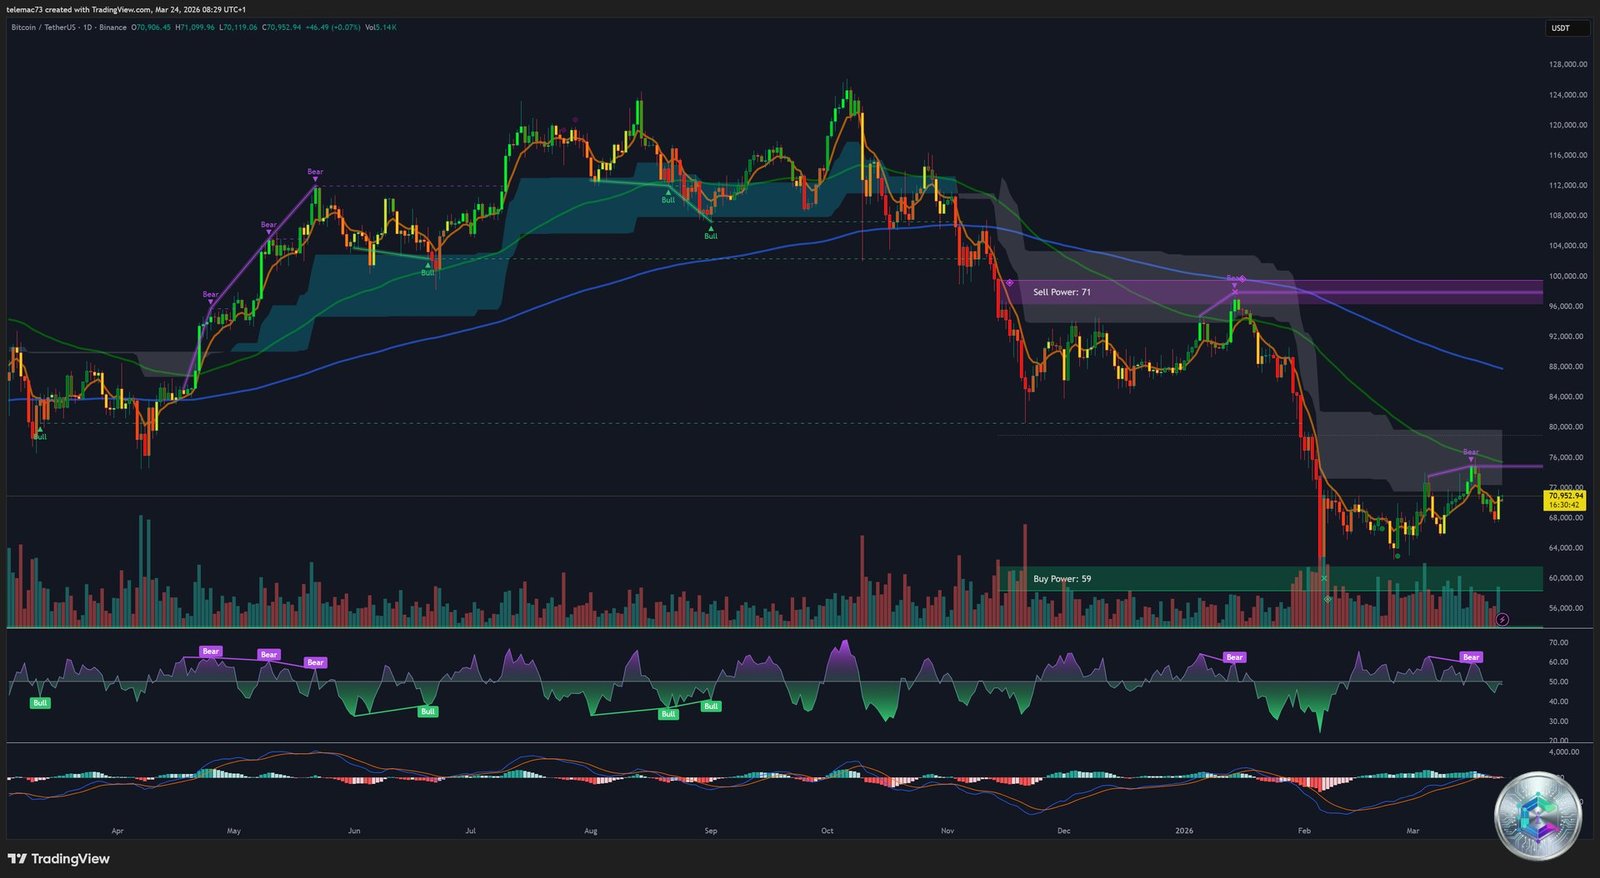
On the daily chart, price action is encapsulated within a classic falling wedge pattern — a traditional long-term bullish continuation formation, purging overvaluation before resuming its advance. The current price of $70,952 is fighting hard to hold above the MA50 ($69,804), having achieved the technical feat of closing above this threshold three consecutive times. However, the formidable MA200 ($71,618) continues to hang over the price like a technical ceiling.
A critical warning signal to monitor: a Death Cross has been detected on the 3-day chart, where the 50-day MA crossed below the 200-day MA. This psychologically heavy signal weighs on long-term investors. Nevertheless, the daily MACD shows contracting red bars and is attempting a bullish crossover, suggesting the bulk of macroeconomic selling pressure has faded.
4-Hour Chart — Structural Reconstruction and Divergences
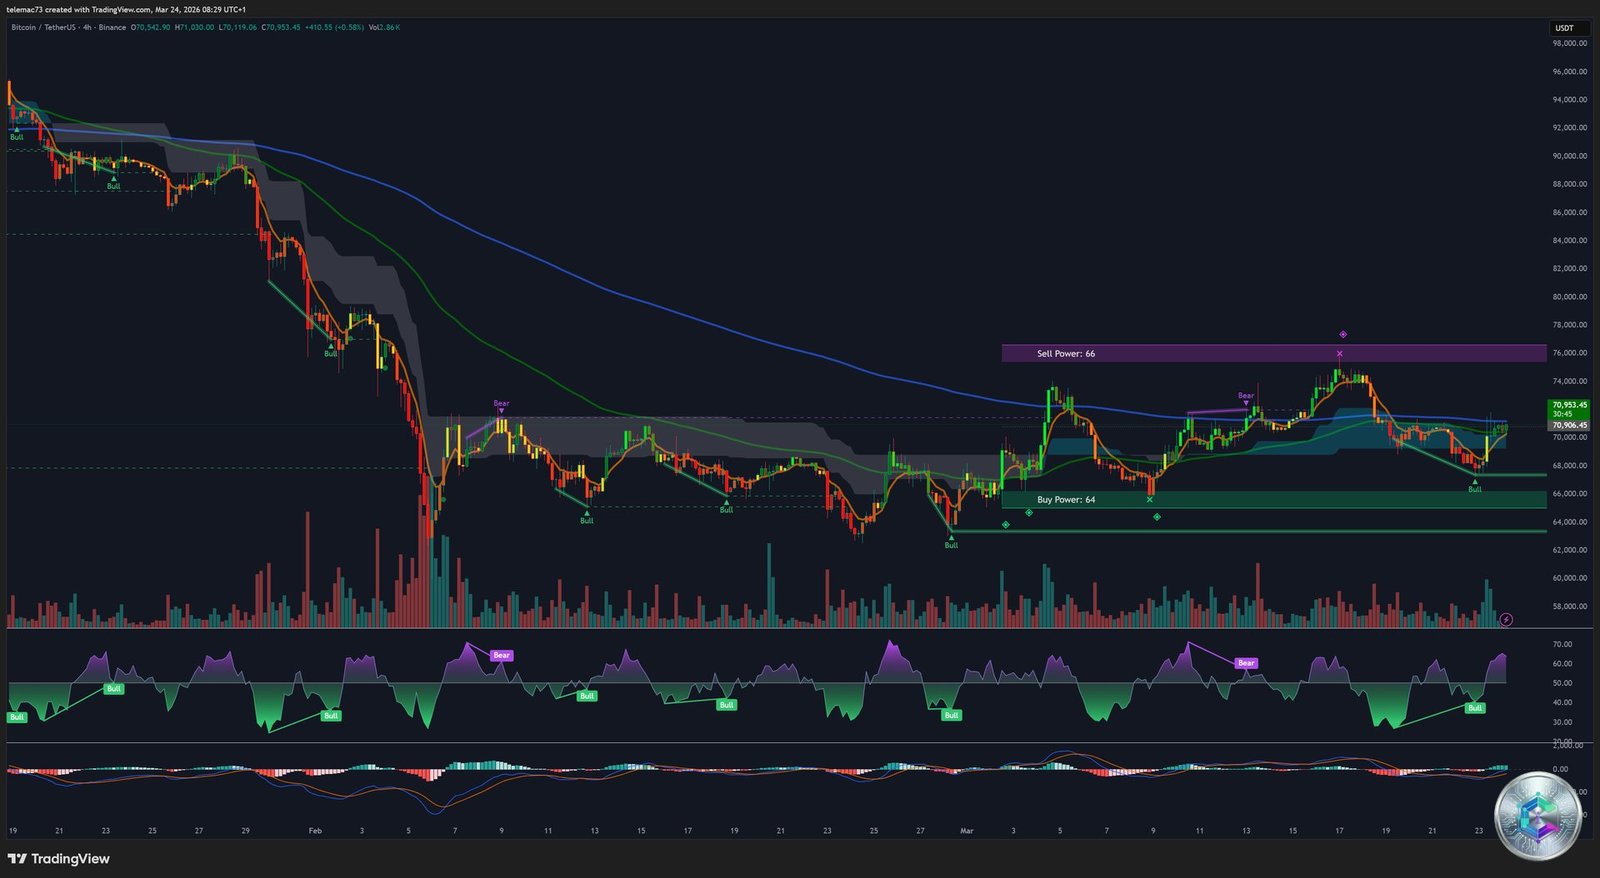
The 4-hour chart reveals a laborious reconstruction after capitulation. Buying and selling forces reach near-parity (Sell Power: 66 vs Buy Power: 64), illustrating the precarious balance defining the current consolidation. Moving averages are visibly beginning to flatten, evidencing a drastic deceleration in bearish momentum and a transition to a ranging market.
The most significant technical element on this timeframe is the bullish divergence from the momentum oscillator: while the Bitcoin price marked a lower low during the peak of geopolitical panic, the oscillator drew a higher low — one of the most powerful medium-term trend reversal signals in technical analysis. The MACD confirms this reading with a golden cross below the zero line and a histogram moving into positive territory.
15-Minute Chart — The « Trump Pump » and the Bull Flag
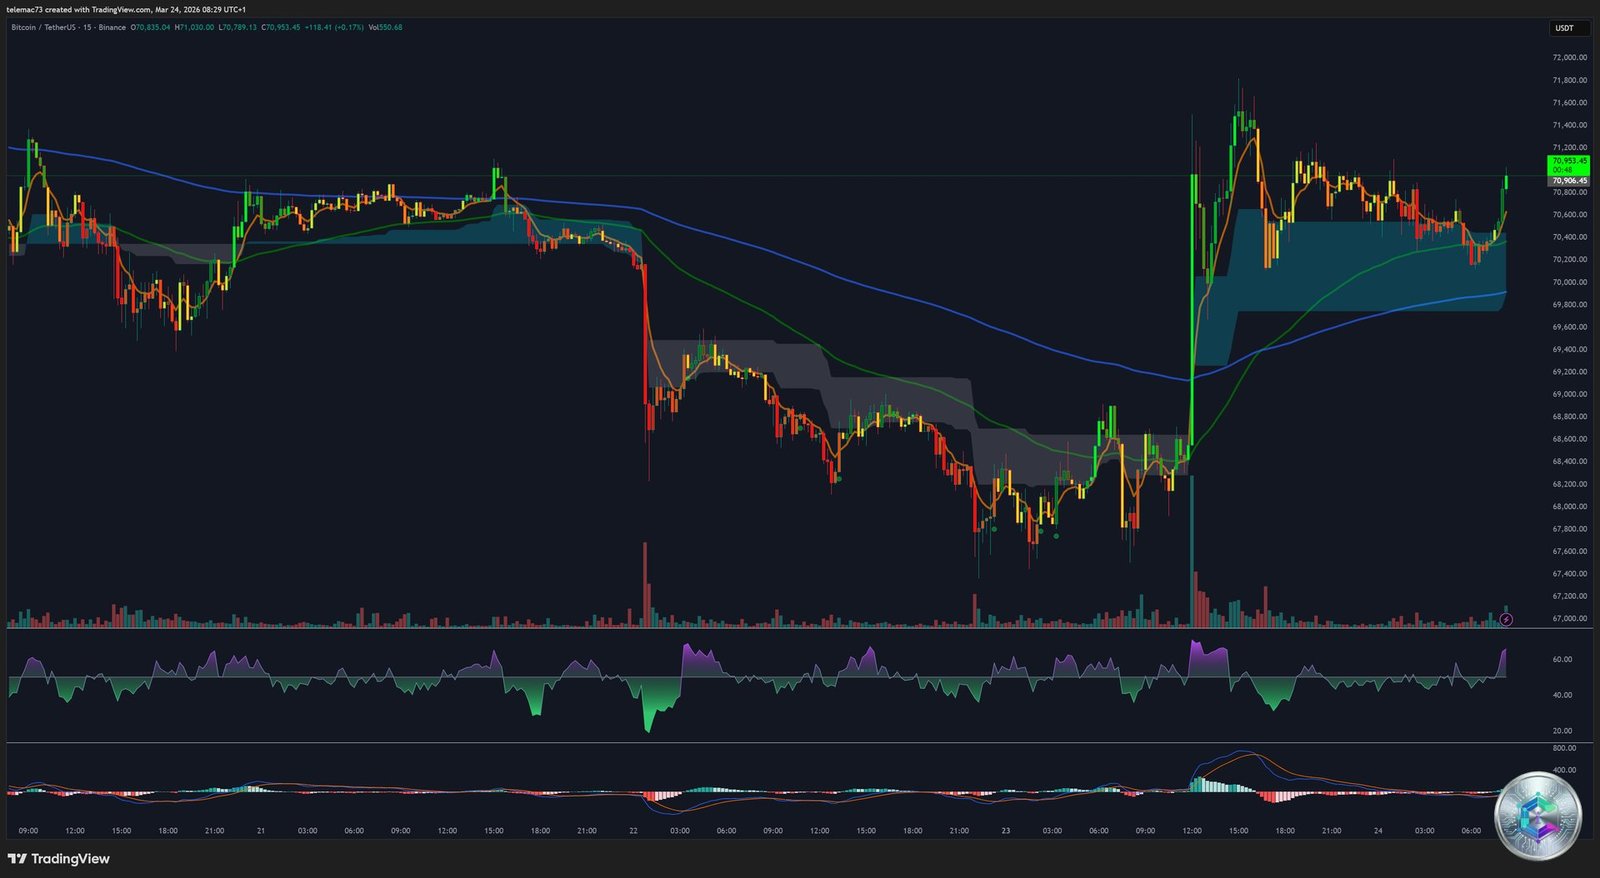
The 15-minute chart captures in real time the visual signature of the « Trump Pump »: a massive vertical green candle that pierced through all local resistances within minutes, propelling the price from $67,300 to $71,800. Following this impulse, price action is tracing a classic bull flag pattern, indicating the market is « digesting » the news while quietly accumulating positions in anticipation of a second leg higher.
However, the oscillator is trending downward after peaking in hyper-overbought territory, and the MACD histogram is contracting — signals of very short-term fatigue. For the bull flag to validate a breakout, a new fundamental catalyst will be needed. Otherwise, the risk of a retest of the heatmap supports remains elevated.
Key Technical Levels Matrix — March 24, 2026
The moving average synoptic table delivers a remarkably balanced verdict (near-perfect neutrality), illustrating a market in mean reversion mode. Short-term averages (MA5, MA10) generate sell signals capturing the post-impulse fatigue. Conversely, intermediate and long-term averages (MA20, MA50, MA100) emit robust buy signals, attesting to the preservation of the macro bullish architecture.
| Level | Price | Role |
|---|---|---|
| Major Resistance | $74,000 – $75,250 | Gamma wall + massive sell-side liquidity |
| MA200 (resistance) | $71,618 | Ultimate bull/bear market boundary |
| R2/R3 Pivot Confluence | $71,098 – $71,111 | Mathematical resistance cluster |
| Current price | ~$70,930 | Consolidation zone |
| Central Pivot (PP) | $70,552 | Intraday center of gravity |
| S1 Confluence | $70,245 – $70,338 | First buyer defense line |
| Psychological Support | $70,000 | Critical threshold — must hold on close |
| S2 Confluence | $69,979 – $69,992 | Major technical fortress |
| MA50 | $69,804 | Dynamic support preserving bull trend |
| LVN Support | $66,000 – $67,000 | Next liquidity zone in case of breakdown |
Momentum Oscillators — Quantitative Snapshot
- RSI (14): 54.21 — Absolute neutrality. Ample room to launch a sustained impulse in either direction without immediately hitting extreme zones.
- MACD (12, 26): +249.87 — Formal buy signal. Directional momentum is on the side of the bulls.
- Stochastic (9, 6): 98.72 — Hyper-overbought in the very short term. Caution signal: high risk of immediate consolidation or slight pullback before any resumption of the uptrend.
Strategic Synthesis: Three Directional Scenarios
🟢 Scenario 1 — Structural Bullish Breakout
Catalysts: sustained diplomatic de-escalation + continued ETF inflow torrent + Hash Ribbons buy signal validation. Chartistically, this scenario requires a clean break above the R2/R3 confluence between $71,100 and the MA200 at $71,618. The destruction of the gamma wall at $74,000–$75,000 via a short squeeze would act as a kinetic accelerator, paving the way to the CME gap liquidity void toward $80,000.
🔴 Scenario 2 — Rejection and Bearish Acceleration
Catalysts: hawkish Fed surprises + resumption of Iran-US escalation. Technically, this scenario translates into repeated failure to break the MA200 and, crucially, the loss of the S2 pivot support around $69,900. A daily close below the MA50 near $68,200 would validate the Death Cross on larger timeframes, triggering a cascade of long liquidations and projecting the asset toward the $63,000 volume profile void.
🟡 Scenario 3 — Magnetic Compression (Most Likely Near-Term)
The iron law of derivatives markets ahead of the massive quarterly expiry. Market makers’ gamma hedging algorithms will deliberately crush directional volatility to keep the spot price gravitating near the Max Pain level. Bitcoin should meander laboriously, artificially contained between the ETF structural floor near $68,000 and the options sellers’ glass ceiling near $72,000, storing the kinetic energy necessary for the next major directional impulse of the nascent April 2026 market.
⚠️ Disclaimer: This article is written for educational and informational purposes only. It does not constitute investment advice, a recommendation to buy or sell, or an invitation to invest in digital assets. Cryptocurrency markets are extremely volatile and carry significant risk of capital loss. Please consult a qualified financial advisor before making any investment decisions.