
As of March 23, 2026, the Bitcoin market is navigating a macro-structural correction of rare intensity. The asset is trading between $67,686 and $68,338, while the Fear & Greed Index has collapsed to a critical reading of 8 out of 100 — a level of « Extreme Fear » unseen since previous systemic liquidity crises. This comprehensive analysis dissects market microstructure, multi-timeframe technical signals, and derivatives dynamics to model the most probable trajectories ahead.
I. Macroeconomic Context: Persistent Headwinds
Restrictive Monetary Policy
The Federal Open Market Committee (FOMC) has maintained its benchmark interest rates within the 3.50%–3.75% range, with a revised dot plot signaling that a majority of officials anticipate no rate cuts in 2026. Inflation forecasts have been revised upward to 2.7%, exacerbated by diesel prices breaching $5 per gallon in the United States. The ECB and Bank of Canada maintain a similarly hawkish stance, while the Bank of Japan remains anchored at 0.75%.
This prolonged high-rate environment exerts a gravitational drag on Bitcoin: without intrinsic yield, the asset suffers from a growing opportunity cost versus government bonds. The collapse of Open Interest below $22 billion reflects a massive migration of speculative capital toward fixed-income markets.
U.S. Regulatory Shock: The SEC/CFTC Duality
March 2026 marks a historic institutional dichotomy. On one hand, a landmark joint 68-page SEC/CFTC publication classified Bitcoin, Ethereum, Solana, and XRP as « digital commodities » — a clarification that should have been a major bullish catalyst. On the other hand, the SEC simultaneously threatens to reclassify a broad range of altcoins as securities under an expansive interpretation of the Howey Test, casting uncertainty over the entire ecosystem. Institutional investors have adopted a strict wait-and-see posture until jurisdictional clarity is achieved.
Gold at $5,000: The Great Decoupling
The « Digital Gold » narrative is facing brutal empirical invalidation. Physical gold (XAU) has surged past $5,000 per ounce, gaining +18% year-to-date, driven by massive central bank purchases and geopolitical tensions (Iran, Taiwan). Bitcoin, meanwhile, shows a rolling 12-month correlation coefficient with gold oscillating between -0.09 and -0.27 — a statistically negative or non-existent relationship. The BTC/Gold ratio has collapsed to approximately 16.68 ounces of gold per Bitcoin — a historically low level.
| Metric | Gold (XAU/USD) | Bitcoin (BTC/USD) |
|---|---|---|
| 2026 Performance | +18% (New ATHs) | Bearish Correction |
| Current Price | $5,170–$5,330/oz | $67,000–$68,500 |
| Demand Driver | Central banks, geopolitics | ETF flows, M2 money supply |
| Risk Perception | Safe-Haven Asset | Risk-On Asset (High Beta) |
II. Market Microstructure — TapeSurf Liquidity Heatmap
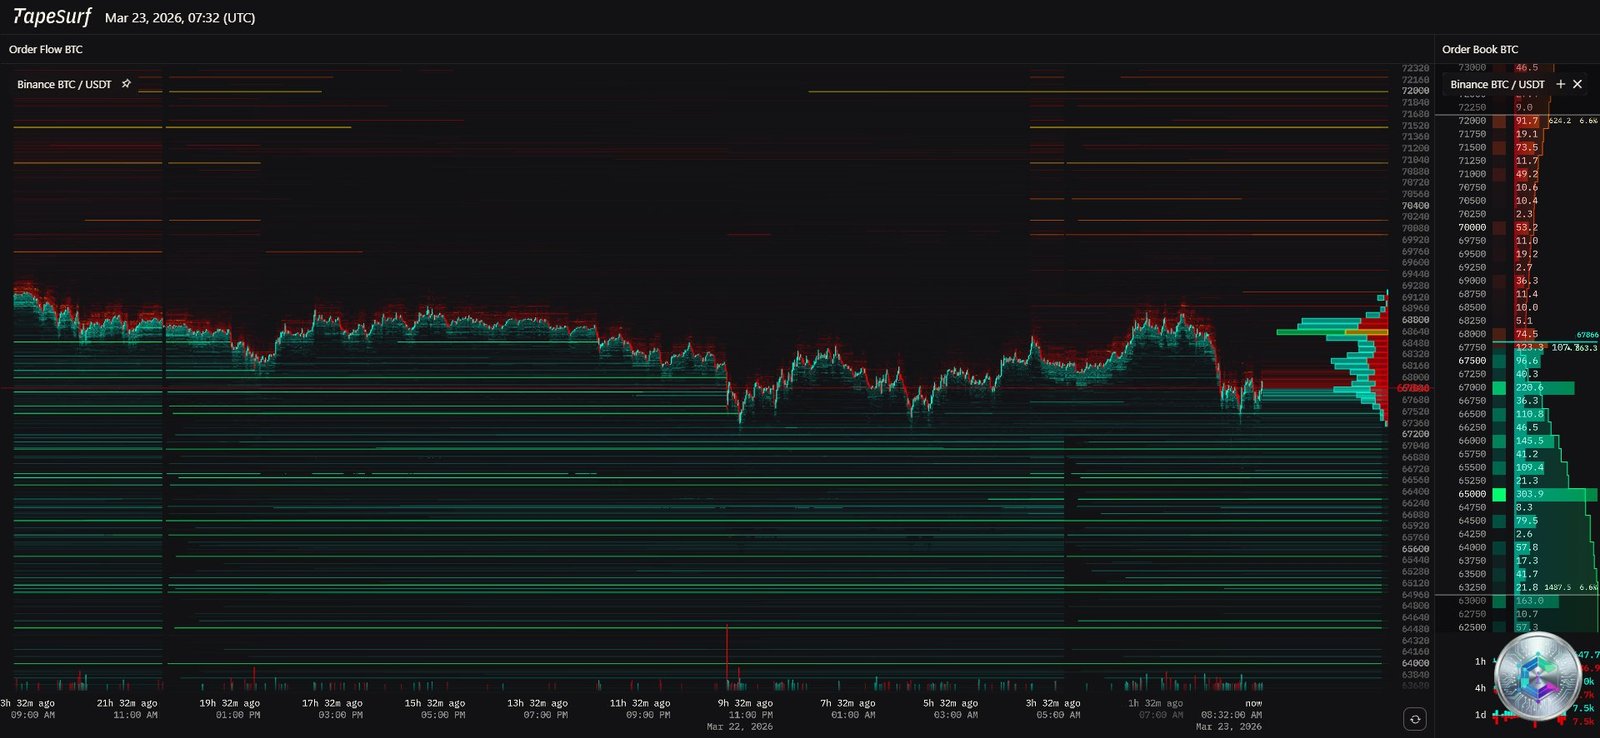
The TapeSurf terminal reveals a deeply asymmetric and stratified order book. The Point of Control (POC) is concentrated between $67,500 and $68,000, acting as the center of gravity for recent transactions. Above current price (~$67,900), multiple dense layers of sell orders (asks) extend aggressively toward $70,000–$72,000, forming colossal « Sell Walls » that suffocate every bullish attempt.
Below $67,000, thick green bands (limit buy orders) provide an absorption cushion. Nevertheless, the overwhelming density of upper resistance confirms a downward asymmetric directional bias: breaching the Sell Walls would require a major exogenous catalyst (Fed pivot, surprise ETF approval) in a hostile hawkish environment.
Market-making algorithms hunt stop clusters: the recent purge of long positions between $67,000 and $68,000 created a relative void of immediate downside liquidity. If price managed to erode the Sell Walls and clear $71,000, it would trigger a chain reaction of forced buybacks (Short Squeeze) toward the upper liquidity pockets identified in the heatmap analysis.
III. Macro-Structural Chart Analysis — Daily (1D) Timeframe
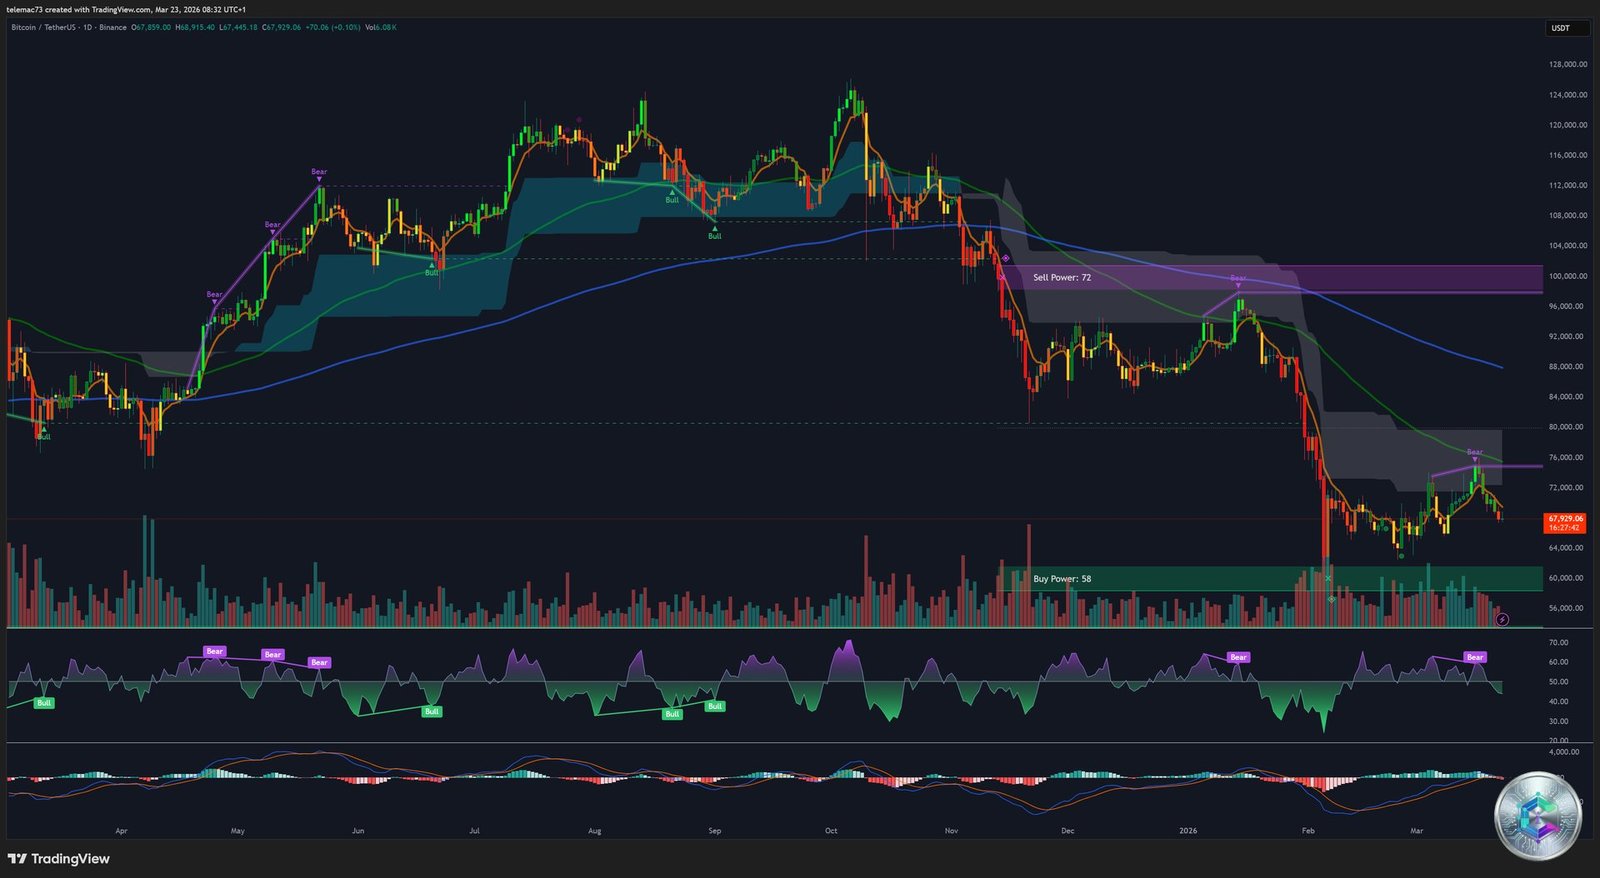
The Death Cross: The Institutional Warning Signal
The most alarming signal on the daily chart is the materialization of a Death Cross — the 50-period EMA crossing below the 200-period EMA. This crossover seals an institutional polarity shift and confirms that bearish momentum has embedded itself in the asset’s long-term temporal structure. Price currently languishes below both dynamic moving averages, and every bounce toward these levels is systematically exploited by institutions to distribute their inventory (sell the rip).
Institutional Power Zones
- Sell Power 72 ($76,000–$80,000): Upper purple rectangle — an institutional iron ceiling. The breakdown below this zone triggered the acceleration of the current decline.
- Buy Power 58 ($60,000–$64,000): Lower green rectangle — the last tangible line of defense. The Sell 72 vs. Buy 58 imbalance mathematically quantifies the sellers’ structural advantage.
Momentum Oscillators: A Slow-Motion Capitulation
The MACD generates deeply negative values, navigating far below the zero line. The histogram shows faint pink bars (lighter red), suggesting a deceleration in the pace of the decline — but no imminent vigorous bullish crossover. The RSI (14), having visited extreme oversold territory (<30) during the free-fall phase, has stabilized in a low neutrality band. The absence of a clear bullish divergence on the daily confirms that a V-shaped recovery is technically unlikely: the asset is condemned to a long, painful accumulation process along the Buy Power zone before any structural recovery.
IV. Intermediate Trend Dynamics — 4-Hour (4H) Timeframe
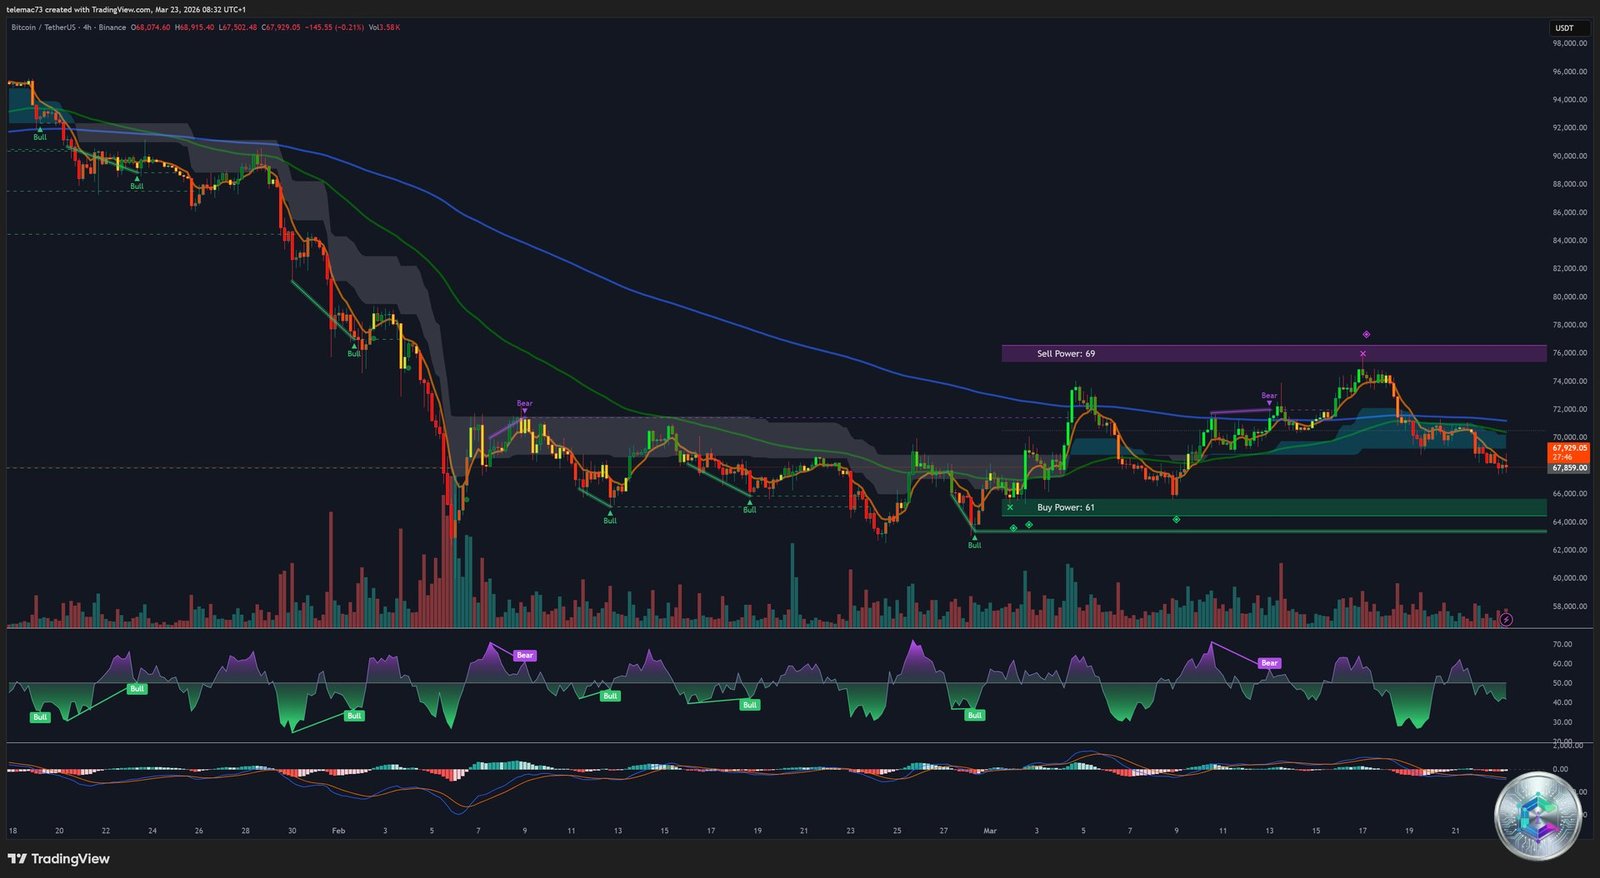
On the 4H chart, price (~$67,929) is evolving within a descending channel, systematically rejected by the descending moving average acting as dynamic resistance. Institutional zones provide precise tactical reference points:
- Sell Power 69 ($74,000–$76,000): zone that recently produced a violent price rejection
- Buy Power 61 ($64,000–$65,000): key intermediate support
Current price sits squarely in a « no man’s land, » explaining the volatility contraction visible on recent candles (small real bodies, long wicks). Minor Bear Flag structures punctuate the descent, each consolidation having resolved with a downside break — textbook trend continuation.
The most compelling technical signal emerges from the 4H MACD: the histogram shows a series of ascending troughs while price continues printing lower lows — a Standard Bullish Divergence in formation. This suggests bearish kinetic energy is exhausting itself. While this signal alone cannot reverse the macro trend, it is a reliable precursor to a technical bounce targeting the resistance MA or the base of the Sell Zone.
V. Intraday Microstructure — 15-Minute (15m) Timeframe
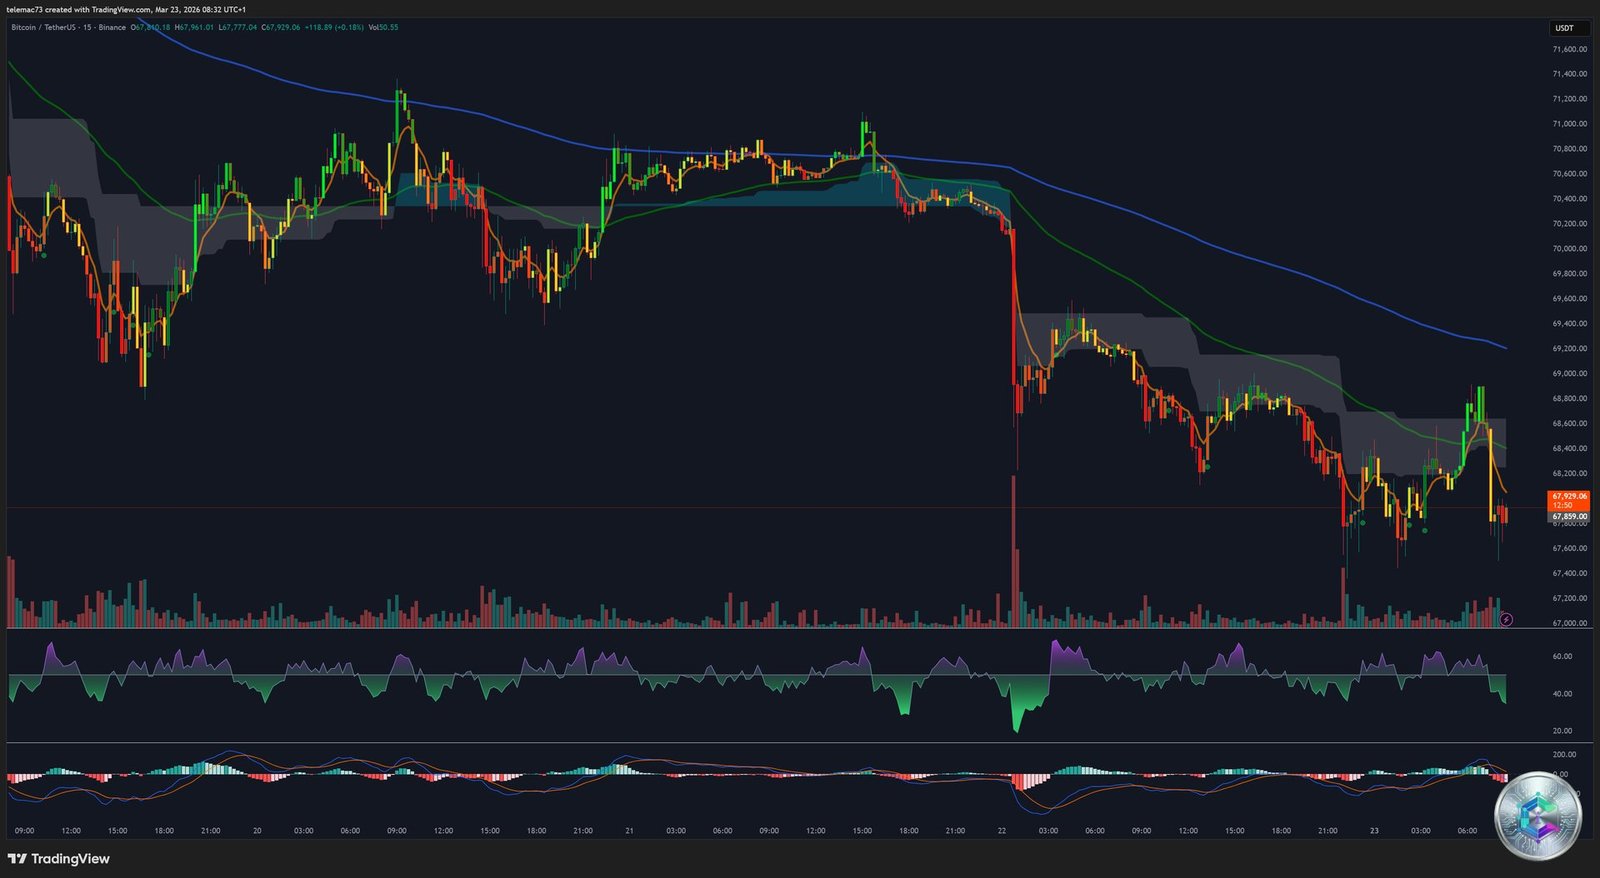
The 15m chart bears witness to extreme directional violence: a liquidation cascade precipitated price from $71,000 down to $67,000, characterized by successive bearish Marubozu candles signaling unilateral seller aggression against a completely deserted bid-side order book (Pulling Liquidity).
The cataclysmic volume spike at the absolute low of the move is the empirical signature of a capitulation event: the maximum surrender of leveraged long positions force-liquidated by exchanges. Paradoxically, it is precisely this spike of forced supply that provides institutional players and arbitrage algorithms with the liquidity needed to absorb assets at a discount without immediately pushing prices back up (Absorption).
Post-capitulation, the market oscillates within an asymmetric compression triangle — a classic algorithmic « Ping-Pong » behavior typical of post-capitulation indecision phases. The 15m MACD, after a violent bullish crossover post-crash, now coils around the zero line (Whipsaw), the signature of a trendless, range-bound market awaiting a new fundamental catalyst.
| Timeframe | Primary Signal | Directional Bias |
|---|---|---|
| Daily (1D) | Death Cross / Distribution | Strongly Bearish |
| 4 Hours (4H) | Bullish MACD Divergence | Neutral → Technical Bounce |
| 15 Minutes (15m) | Capitulation Volume / Chop | Lateral Consolidation |
VI. On-Chain Data, ETF Flows, and Derivatives
Spot ETF Resilience: A Structural Dissonance
Despite the brutality of the price correction, U.S. Bitcoin Spot ETFs demonstrate remarkable resilience. BlackRock’s IBIT is recording daily inflows of $139.4M and Fidelity’s FBTC of $64.5M. In aggregate, ETF absorption exceeds miner annual new issuance by more than double. MicroStrategy has also reinforced its holdings beyond 761,000 BTC, effectively establishing a structural institutional price floor.
Negative Funding Rates: Fuel for a Potential Short Squeeze
Open Interest has hemorrhaged below $22B, validating a massive speculative deleveraging event. Critically, perpetual futures funding rates have turned negative, indicating that Shorts are dominant and paying a premium to Long positions to maintain their bearish bets. Historically, a prolonged over-extension of negative funding rates combined with a Fear & Greed reading of 8/100 creates the ideal thermodynamic conditions for an explosive Short Squeeze if an unexpected catalyst forces sellers to cover.
VII. Probabilistic Scenario Modeling
🟡 Base Case — Exhausting Consolidation and Technical Bounce (60%)
The asset, mathematically oversold at the medium-term level but structurally damaged at the long-term level, is likely to oscillate within the $64,000–$71,000 range. A violent technical relief rally, fueled by the forced closure of over-exposed short positions (localized Short Squeeze), is probable, targeting the 4H dynamic resistance MA or the base of the daily Sell Power zone. Without a macroeconomic paradigm shift (Fed pivot), this bounce will be treated by institutional algorithms as a liquidity distribution opportunity.
🔴 Macro Deterioration Scenario — Structural Capitulation (30%)
If bond yields continue to surge under energy inflation pressure, or if the SEC initiates enforcement actions against major ecosystem entities, the critical Buy Power support zone ($60,000–$64,000) could break down. Such a breach would trigger a large-scale stop cascade (macro long squeeze), driving Bitcoin into a prolonged structural bear market and definitively confirming the hegemony of the daily Death Cross.
🟢 Systemic Resurgence Scenario — Impulsive Bullish Breakout (10%)
An unexpected macroeconomic reversal (deflationary shock forcing an emergency Fed rate cut) or an extremely favorable legislative arbitrage overriding the SEC could act as an exogenous catalyst. In this scenario, the liquidation of the massive Sell Wall visible on TapeSurf would create an algorithmic air pocket, generating a parabolic move targeting previous all-time highs. Mathematically improbable at very short notice given the current liquidity landscape.
Conclusion: A High-Precision Trading Environment
The current Bitcoin configuration should be interpreted not as a naive directional accumulation opportunity, but as a high-precision, high-toxicity trading environment where capital preservation against microstructural volatility takes priority over anticipating a macro cycle reversal. The market is awaiting a fundamental catalyst — until then, it will continue to extract liquidity from undisciplined participants operating between the defined Power Zones.
⚠️ Disclaimer: This article is written for educational and informational purposes only. It does not constitute investment advice or a recommendation to buy or sell any digital asset. Cryptocurrency markets are extremely volatile and carry significant risk of capital loss. Please consult a qualified financial advisor before making any investment decision.