
Introduction: A Tectonic Tipping Point
Bitcoin (BTC) is trading around $70,741 in March 2026, at an inflection point few market participants anticipated with such precision. The environment is characterized by heightened volatility — the product of a rare convergence: unexpected monetary tightening, exogenous geopolitical shocks, and a market microstructure under extreme tension.
This report dissects, with institutional granularity, the underlying dynamics governing price action by combining a global macroeconomic analysis, an order book microstructure study (Heatmap), and an exhaustive chartist modeling across multiple timeframes (daily, 4-hour, 15-minute).
After an aggressive bullish sequence that propelled the asset toward the critical resistance of $76,000, an abrupt correction brought prices back below the psychological threshold of $70,000, reaching an intraday low of $69,400 during the European session on March 19, 2026. This spectacular sentiment reversal — from « institutional euphoria » to « extreme fear » — can only be understood by examining the macroeconomic gravitational forces currently draining global liquidity.
⚡ The Macroeconomic Environment: The Perfect Storm
The Fed and the « Hawkish Hold »
The primary catalyst behind the recent price contraction lies in the Federal Reserve’s stance at its March 2026 meeting. Against residual expectations of easing, the Fed opted to maintain its policy rate within the restrictive range of 3.50% to 3.75%. This decision, termed a « Hawkish Hold, » was accompanied by macroeconomic projections that have profoundly altered risk appetite.
- PCE inflation revised upward to 2.7% for 2026 — well above the 2% target
- US GDP growth confirmed at 2.4% — giving the Fed ample room for a « higher for longer » stance
- Probability of an April rate cut: near zero
- Marginal probability of an additional hike: 4% according to futures markets
For an asset like Bitcoin that generates no intrinsic yield or dividends, maintaining a high cost of carry represents a major structural headwind. Institutional portfolio managers are mechanically repricing the risk premium required for crypto exposure, reallocating capital toward the US dollar, which has significantly appreciated on foreign exchange markets.
The Energy Shock and Geopolitical Contagion
Alongside monetary pressures, geopolitical tensions in the Middle East — involving threats to oil infrastructure and strategic maritime routes like the Strait of Hormuz — have triggered a dramatic surge in energy prices. Brent crude surged above $114 per barrel, directly fueling the narrative of imported inflation and potential stagflation.
The structural correlation between Bitcoin and US tech indices (S&P 500, Nasdaq-100) remains persistent, estimated at close to 94% in some crypto market analysis reports. In the face of uncertainty, capital has fled digital assets to seek refuge in the US dollar and physical gold, the latter approaching all-time highs.
🔬 Market Microstructure: Decoding the Liquidity Heatmap

The liquidity heatmap from TapeSurf on the Binance BTC/USDT pair provides a real-time radiograph of the intentions of algorithmic and institutional operators.
Liquidity Architecture
🔴 Sell Walls
Intense red and orange bands visible above the current price, ranging between $71,500 and $72,000, with residual concentrations extending to $74,000. These zones represent a massive accumulation of limit sell orders (Asks).
🟢 Buy Walls
Dense green strata below the current price: $69,500, $69,000, and very densely around $68,000 and $65,000. These levels constitute the organic safety net of the market.
The Liquidation Mechanics and Magnet Effect
The most crucial quantitative insight concerns the concentration of derivative liquidations. A colossal liquidation wall is located precisely around $71,800, dominated by short positions using extreme leverage of 50x to 100x.
If price action pierces the $71,000 zone, it will mechanically trigger a cascade of market buy orders — the infamous « Short Squeeze » — propelling the price algorithmically and violently through upper resistance levels, as short sellers are forced to buy back their losing positions.
Spoofing and Iceberg Orders
The contemporary Bitcoin market is dominated by high-frequency algorithmic trading (HFT). Dynamic reading of heatmaps like this one frequently reveals algorithmic deception:
- Spoofing: A large operator places a massive sell wall (e.g., at $72,000) to create bearish psychological pressure, then cancels it instantly as price approaches.
- Iceberg Orders: The robust defense historically observed around $69,000 suggests buying algorithms silently absorbing large quantities of market sellers without displaying their full demand — a precursor sign of medium-term institutional positioning.
📊 Daily Chart Analysis (1D): Structures Heavy with Consequence
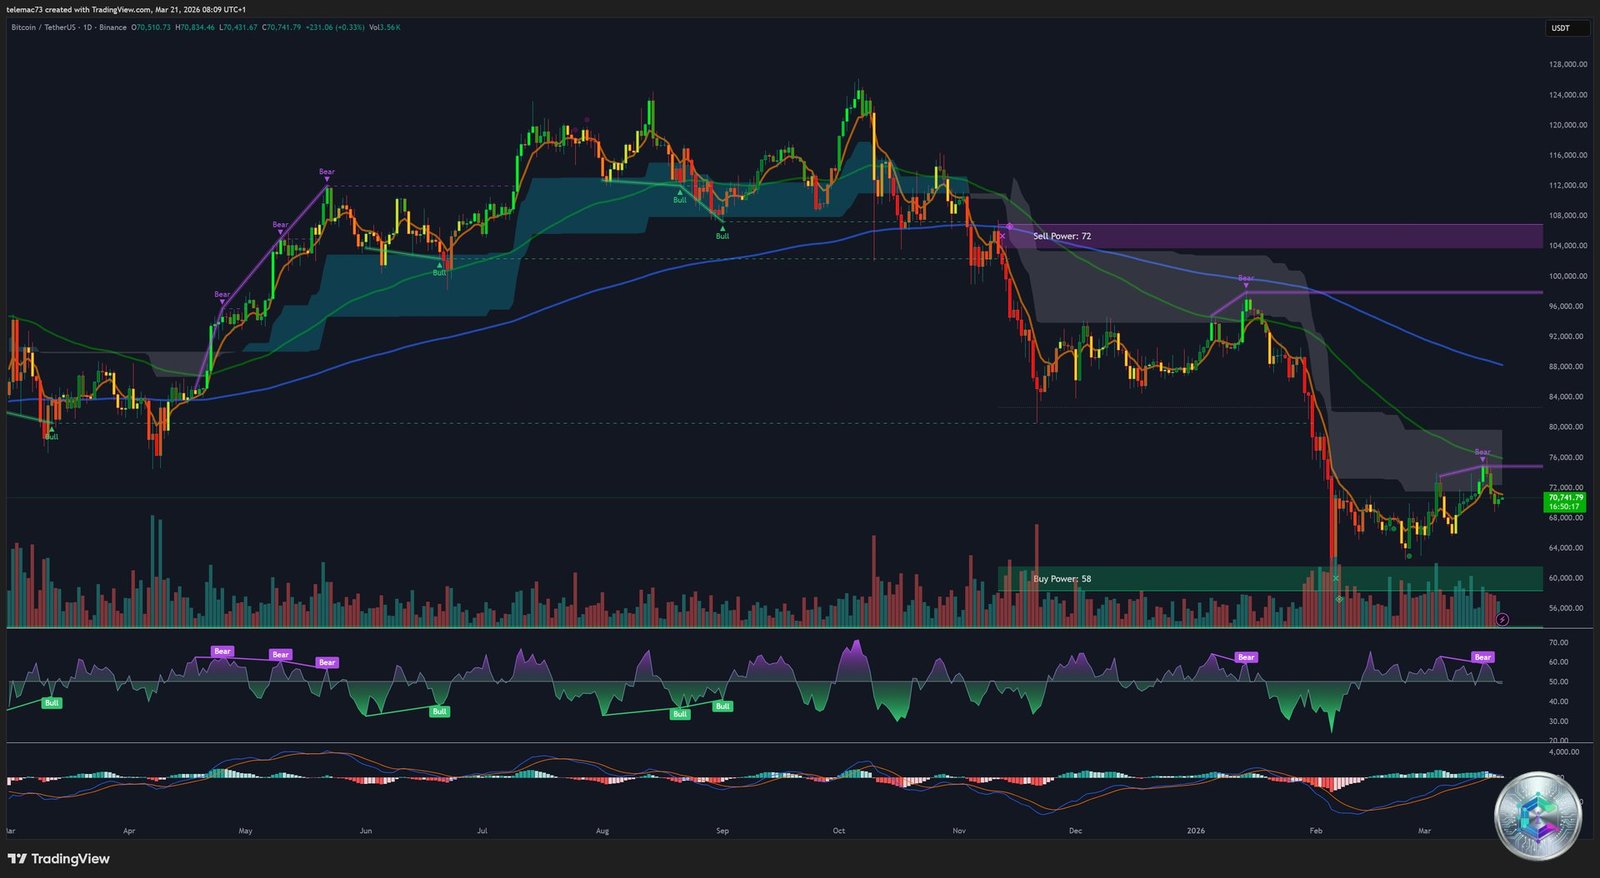
The Evening Star
The massive rejection from the $76,000 zone has generated a classic Japanese candlestick pattern known as an Evening Star. This three-candle formation materializes total exhaustion of buying pressure, followed by an aggressive takeover by selling forces. The critical resistance of $74,450 — a former April 2025 support turned resistance through polarity inversion — confirms the solidity of the ceiling.
⚠️ The Death Cross
The most discussed technical signal: the imminent confirmation of a Death Cross, i.e., the downward crossing of the 50-day EMA below the 200-day EMA. Historically, as during the 2022 bear cycle, this crossing has preceded average declines of 35% in the months that followed.
However, institutional analysis demands second-order thinking: a Death Cross reflects the weakness of the preceding 60 days, not a mathematical certainty about the future. In a market dominated by ETF buying, this signal could paradoxically operate as a Bear Trap — providing the liquidity institutional funds need to accumulate discreetly without immediately driving prices up.
Daily Oscillators
- MACD: Deeply in negative territory, validating the loss of bullish momentum. No sustained bullish crossover (Golden Cross) visible.
- RSI: ~44, in low neutral zone. The RSI has not yet reached extreme oversold levels (below 30) on the daily timeframe — indicating the price structure still has the elasticity to push lower before triggering massive mean-reversion buying.
📈 4-Hour Chart Analysis (H4): The Bear Flag
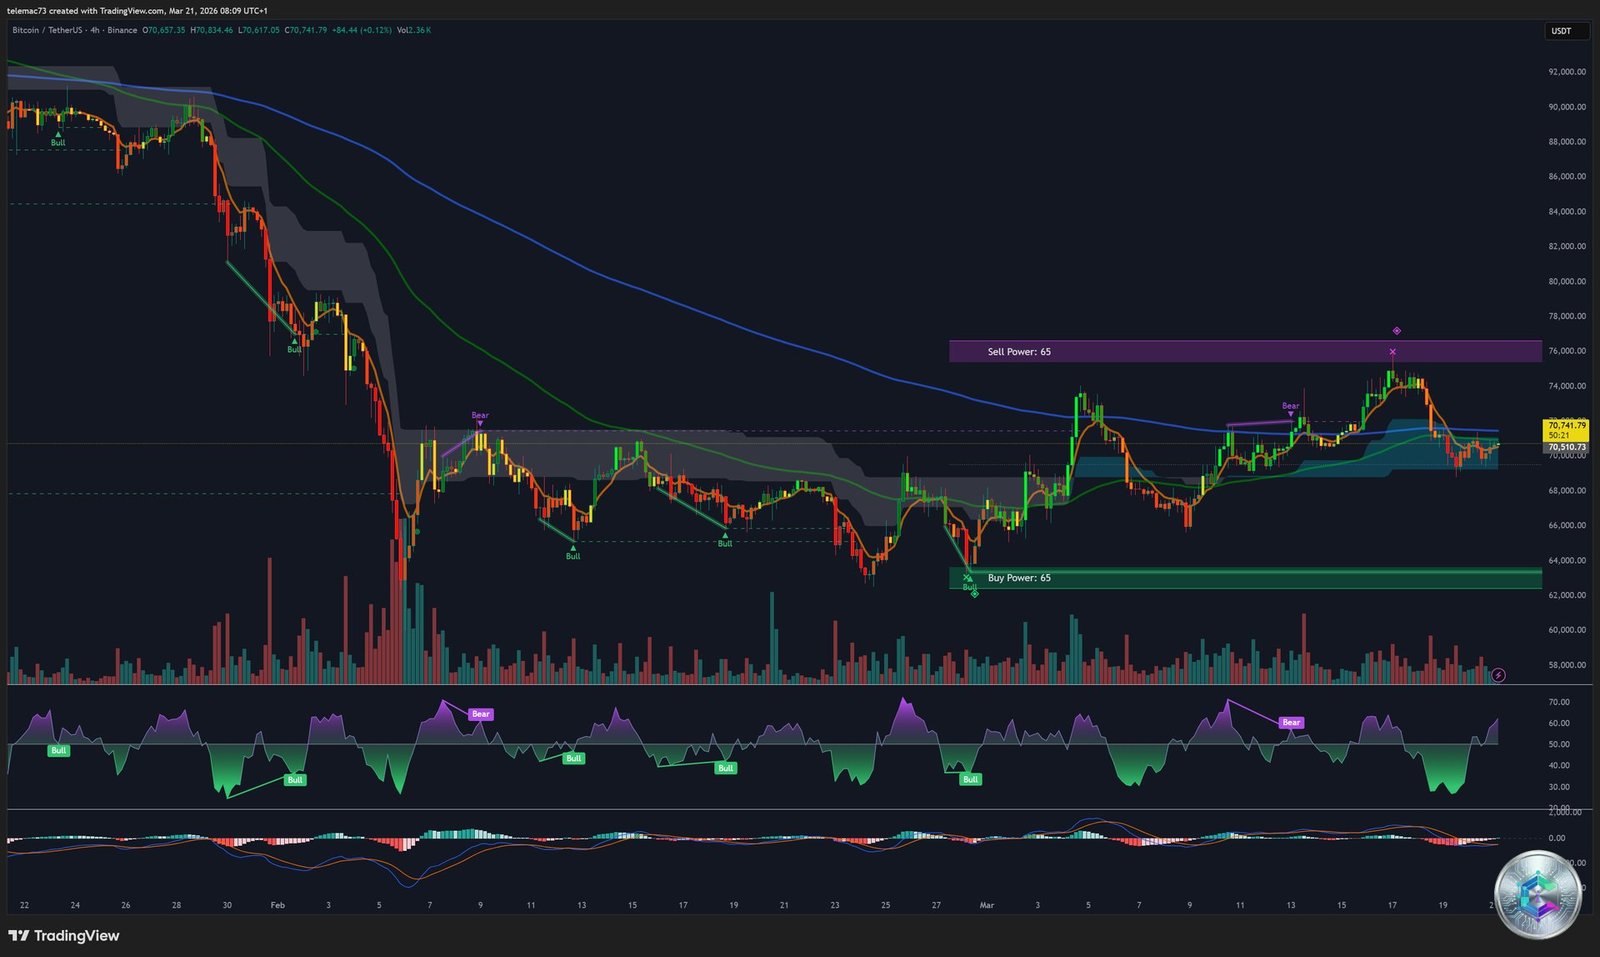
The dominant observation on the H4 chart is the formation of a clear Bear Flag, a classic continuation chart pattern comprising two distinct phases:
- The Flagpole: The vertical, aggressive collapse from $76,000 highs to $69,000 lows, supported by heavy institutional distribution volumes.
- The Flag: Following the drop, price initiates a weak rebound within an ascending parallel channel — a psychological trap representing profit-taking by initial short sellers combined with imprudent retail buyers attempting to « catch a falling knife. »
Chart theory attributes a high success rate (estimated between 68% and 84% for digital assets) to a downside breakout from this formation. The theoretical price target, calculated by projecting the flagpole length from the breakout point, mathematically targets the $61,000–$65,000 zone.
Price remains crushed beneath the 200 EMA at $72,600. As long as this level acts as an insurmountable ceiling, the medium-term trend remains classified as bearish. That said, the H4 MACD is displaying a bullish crossover in negative territory — a nascent momentum not yet confirmed, susceptible to producing a fatal whipsaw.
⏱️ 15-Minute Analysis: The Revolver’s Barrel
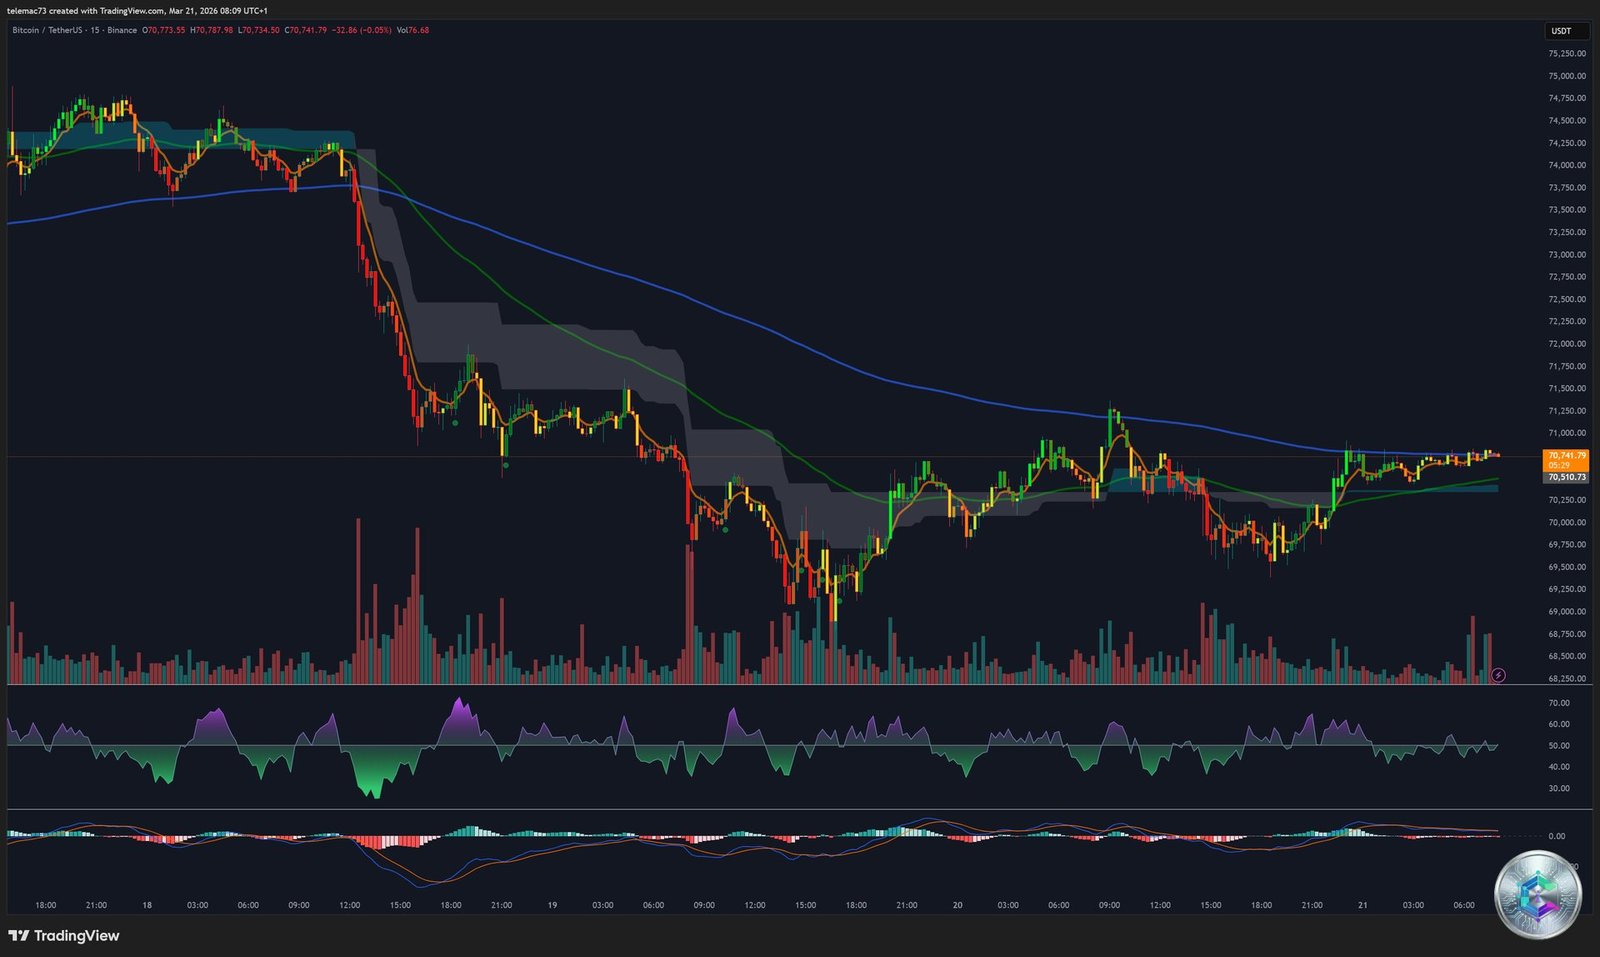
On the 15-minute timeframe, price is progressively compressing within a symmetrical triangle: lower highs and higher lows, drawing a geometric compression figure. This pattern reflects a temporary equilibrium — an equal-force standoff between supply and demand.
As price approaches the apex, volatility collapses, accumulating considerable kinetic energy. The resolution of this triangle will act as the trigger for the next directional impulse on the H4. The 15m RSI dives below 30 during local forced liquidations before nervously rebounding above 60, confirming the activity of buying algorithms programmed at precise levels around $69,500.
🗺️ Mathematical Pivot Points Map
| Level | Estimated Price (USD) | Significance |
|---|---|---|
| R3 | ~$74,700 | Total invalidation of bearish bias — historic Short Squeeze |
| R2 | ~$73,750 | Top of Wave « A » — massively concentrated latent supply |
| R1 | ~$72,500 | Initial glass ceiling, just above the $71,800 liquidation wall |
| Pivot (P) | $70,569 | Gravitational equilibrium point — current price attempting bullish shift |
| S1 | ~$69,000 | Primary defense line — floor currently being tested |
| S2 | ~$66,200 | 50-day EMA — break = medium-term capitulation |
| S3 | ~$64,800 | Deep liquidity zone — cycle accumulation opportunity |
🧠 Second and Third-Order Deductions
The Death Cross vs. Wall Street Paradox
One of the most fascinating analytical contradictions: the simultaneous emergence of an imminent Death Cross and over 13,460 BTC absorbed by « Whale » wallets (holding 100K to 1M BTC) in a single month. Retail investors are selling in anticipation of a crash. Meanwhile, large ETF asset managers — who trade on structural long-term allocation mandates, not lagging moving averages — exploit this panic to execute massive orders without creating uncontrollable slippage. Frightening bearish technical signals are thus transformed into masterful Bear Traps against the crowd.
The Self-Correcting Macroeconomic Loop
On a third-order horizon: if energy prices remain prohibitive due to persistent geopolitical tensions, the global economy will face severe stagnation. The Fed will inevitably be confronted with a Cornelian dilemma — maintain mortifying positive real rates and trigger a major economic depression, or capitulate and cut rates in an inflationary environment (ruling that supply-side inflation cannot be cured by rates) to save employment. Historically, central banks invariably end up printing money. When this capitulation materializes, Bitcoin — capped at 21 million units — will cease to be traded as a tech equity and will fully reclaim its ultimate narrative of asymmetric protection against sovereign currency debasement.
🎯 The Two Modeled Scenarios
🐻 Bearish Scenario — Controlled Capitulation
Target: $61,500 – $64,500
- Failure to break R1 ($71,840)
- H4 Bear Flag breaks to the downside
- Daily Death Cross activated
- Cascade of long liquidations toward S3 ($64,800)
- Full leverage purge — healthy base for reload
🚀 Bullish Scenario — Short Squeeze Explosion
Target: $74,450 – $76,000
- Holding above $70,000 = institutional absorption
- Bullish breakout from 15m triangle
- Short Squeeze triggered at $71,800
- Bear Flag H4 invalidated
- Violent confrontation with major resistance at $74,450–$76,000
Conclusion
The Bitcoin market currently demands surgical execution discipline. Abandoning analyses based exclusively on lagging moving averages in favor of a granular reading of order flow (Tape / Heatmap) and mathematical geometry (Pivot Points) represents the only decisive competitive edge for navigating this environment of historical value redefinition. The current macroeconomic weakness may only be the preliminary compression of a fundamental spring — destined to release with a violence proportional to the monetary crisis on the horizon.
⚠️ Disclaimer
This article is written for educational and informational purposes only. It does not constitute investment advice, nor a recommendation to buy or sell digital assets or any other financial instrument. Crypto-asset markets are extremely volatile and carry a risk of capital loss of up to 100%. Before making any investment decision, please consult a licensed financial advisor. Past performance is not indicative of future results.