
As of March 20, 2026, Ethereum (ETH) stands at a paradigmatic confluence of rare intensity. Trading between $2,137 and $2,339, the leading smart contract asset presents a striking structural dichotomy: short-term price action under sustained selling pressure amid an « Extreme Fear » market sentiment (index at 15/100), while its on-chain fundamentals and macroeconomic catalysts have never appeared more robust. This report deploys a multi-dimensional analysis integrating order flow, multi-timeframe charting, and fundamental drivers.
Macro-Financial Context and Network Fundamentals
The Fusaka Upgrade: A Structural Game-Changer
The most decisive fundamental catalyst for Ethereum’s long-term valuation is the successful integration of the « Fusaka » upgrade in December 2025. Succeeding the Pectra upgrade, Fusaka combines improvements to the consensus layer (« Fulu ») and the execution layer (« Osaka »), marking the culmination of the Rollup-centric roadmap.
The core innovation is the implementation of Peer Data Availability Sampling (PeerDAS), enabling validators to verify data integrity by sampling only a random fraction of blobs — reducing bandwidth requirements by nearly 80% while multiplying blob processing throughput by eight. The economic implications are colossal: an estimated reduction of 60% to 95% in L2 transaction fees for Arbitrum, Optimism, and Base, driving explosive growth in dApp usage and real-world asset (RWA) tokenization. Via the EIP-1559 burn mechanism, this hyper-activity transforms Ethereum into a structurally deflationary asset.
Supply Scarcity: The Point of No Return
Ethereum’s supply dynamics have crossed a mathematical point of no return. In March 2026, 37.9 million ETH are locked in staking contracts, representing 30.5% of total supply. This massive withdrawal from liquid circulation creates a natural mechanical friction against panic selling.
Simultaneously, institutional spot ETFs have absorbed approximately 3.8% of all circulating Ether since their approval. On-chain behavioral data confirms the trend: a 30% increase in ETH held in pure accumulation wallets has been recorded since early 2026. A landmark example: a whale recently deployed $111.62 million to acquire 50,706 ETH at an average price of $2,201, making an aggressive return to the market after selling approximately one year earlier around $3,892.
This divergence is the most reliable fundamental precursor of a violent and imminent supply shock: transactional activity increases, TVL grows, liquid supply collapses — and yet the price is down 30% from its highs.
Macroeconomic Correlation: The Russell 2000 Signal
Historical analysis reveals a macro fractal structure linking the Russell 2000 index to Ethereum’s price discovery phases. Models show that in 2021, Ethereum generated a 226% return approximately 119 days after confirmation of a bullish Russell 2000 breakout. In March 2026, the Russell 2000 has just printed a new all-time high above 2,738 points. If the liquidity lag model repeats, a massive rotation of capital toward the Ethereum ecosystem is imminent.
Market Microstructure Analysis: Liquidation Heatmap
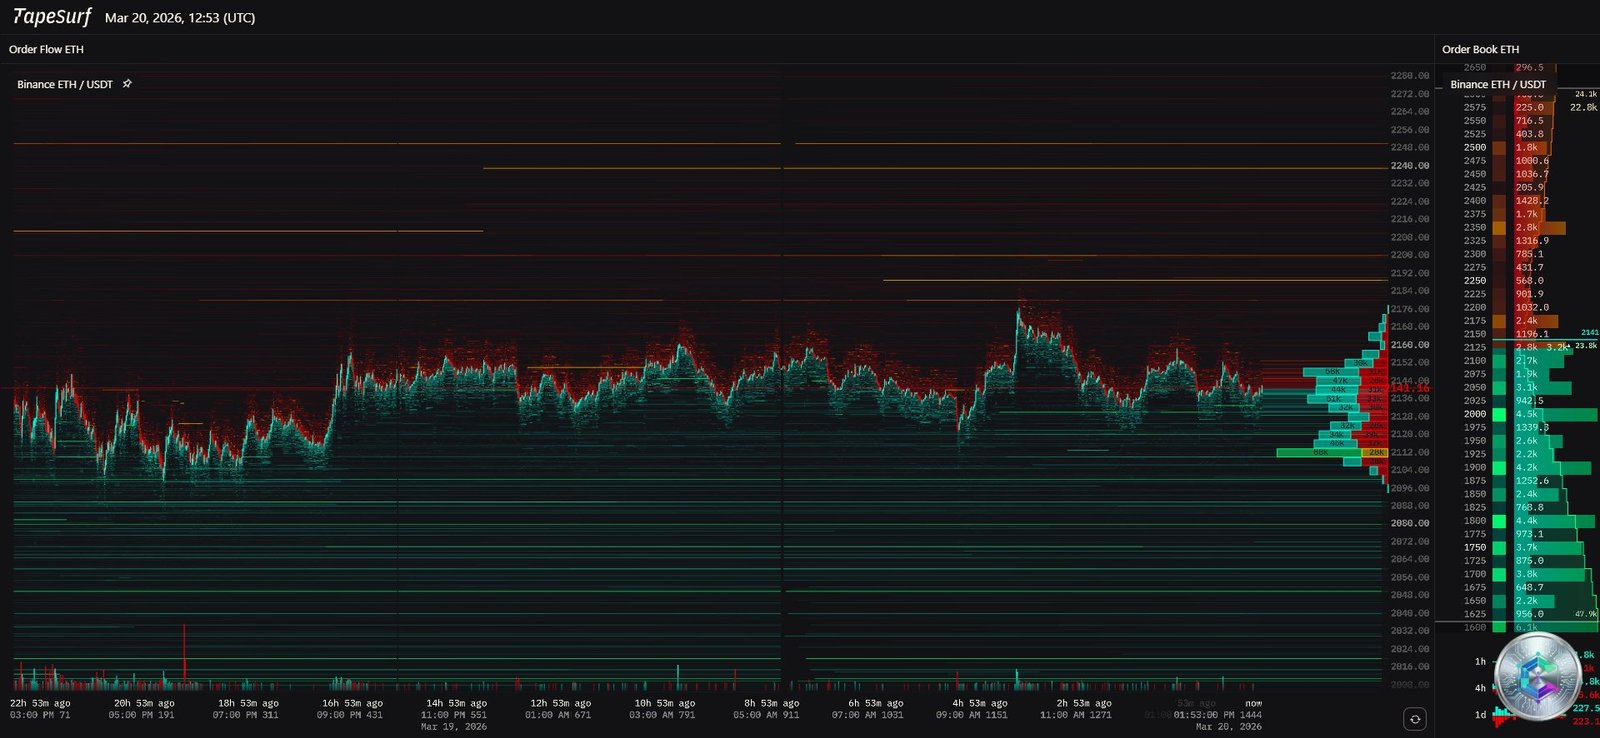
The Order Flow Heatmap on Binance ETH/USDT reveals the spatial distribution of unexecuted limit orders:
- Resistance Walls (Sell Walls): A massive concentration of sell-side liquidity is stacked between $2,160 and $2,400, with peaks at psychological levels of $2,160, $2,200, and $2,240. These walls algorithmically suppress any bullish breakout attempt.
- Support Floors (Buy Walls): The lower section displays dense buy order blocks between $2,080 and $2,122, with volumes of 47k to 68k ETH strategically positioned to absorb selling pressure.
Risk Asymmetry: Long Squeeze vs. Short Squeeze
The current market presents a critical risk asymmetry tied to leveraged positions:
- Long Squeeze Risk: A breakdown below $1,886 would trigger cascading liquidations of long positions totaling over $667 million, creating a destructive downward spiral.
- Short Squeeze Potential: Conversely, a breakthrough above $2,389 to $2,739 would vaporize between $234.8 million and $990 million in short positions, launching the price toward the open CME Gap between $2,405 and $2,665.
Multi-Timeframe Technical Analysis
Macro View — Daily Chart (1D)
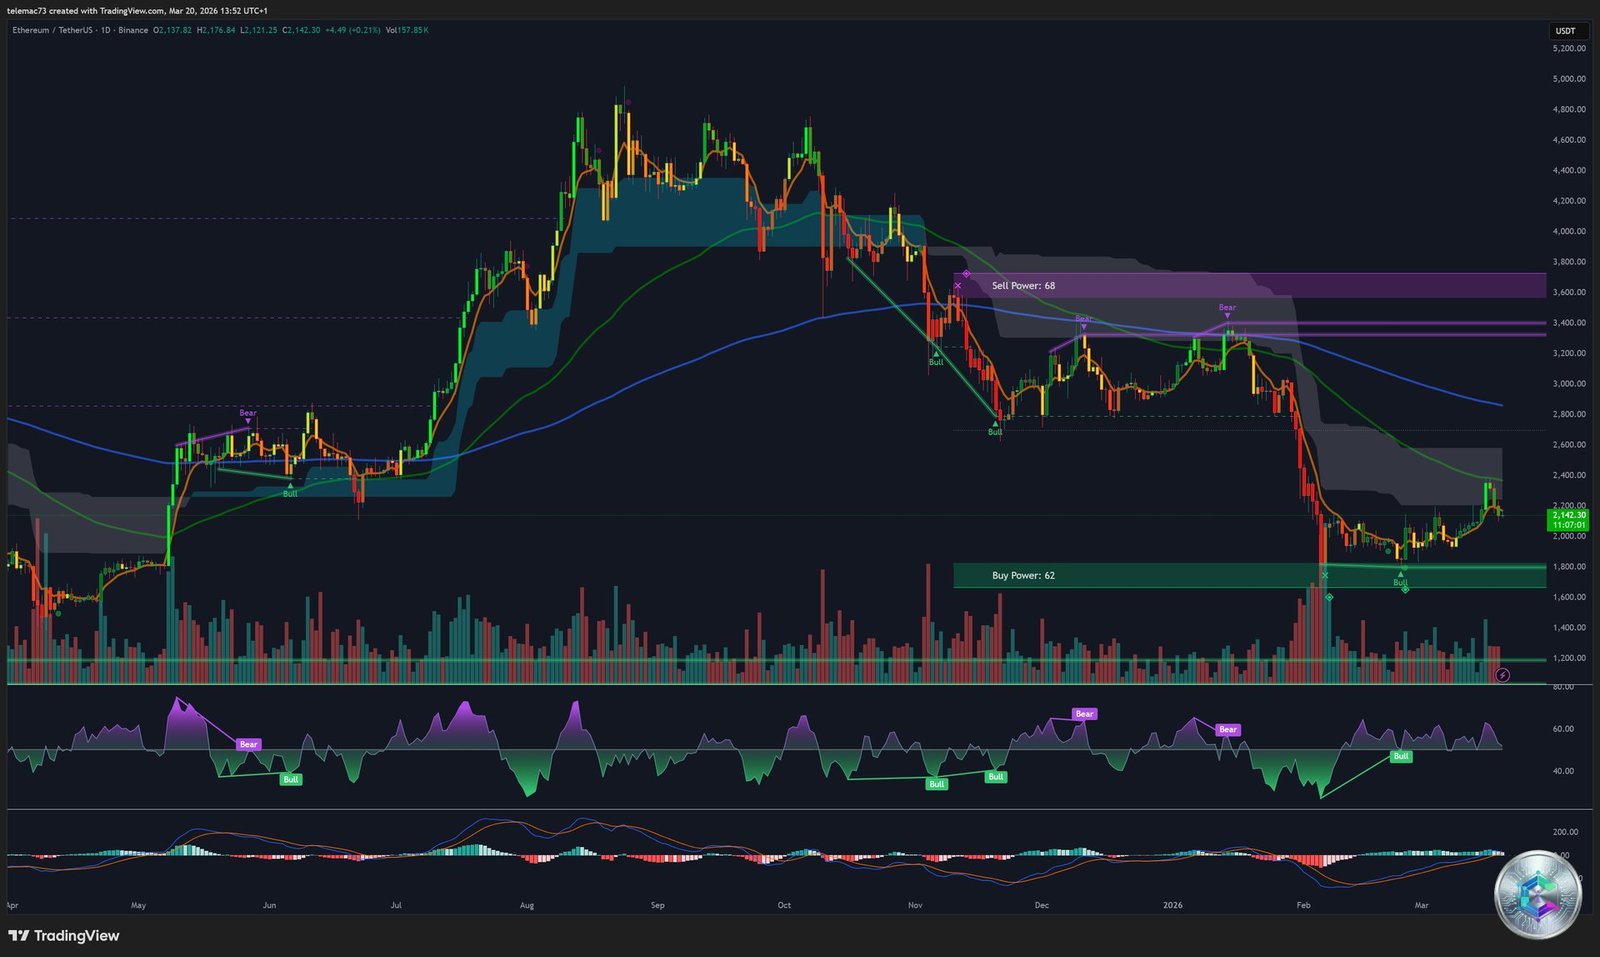
The daily chart illustrates the recent market cycle: a surge toward $4,000–$5,000 in 2025, followed by a correction erasing over 50% of valuation, bringing spot price to $2,142.30.
Key institutional indicators:
- Sell Power (Purple Zone): Anchored between $3,400 and $3,600 — the institutional distribution stronghold and major macroeconomic resistance.
- Buy Power (Green Zone): Structural floor between $1,600 and $1,800 — price violently bounced before deeply penetrating this zone, confirming fierce defense by major capital.
- Death Cross: The MA50 crossed below the MA200, triggering systematic selling by CTA funds and trend-following algorithms.
- Daily RSI: Deeply in oversold territory (readings between 23.47 and 41.04), signaling exhaustion of sellers’ kinetic energy.
- Symmetrical Triangle: The post-crash consolidation forms a symmetrical triangle whose apex is expected by spring 2026 — an explosive directional breakout is imminent.
Intermediate View — 4-Hour Chart (4H)
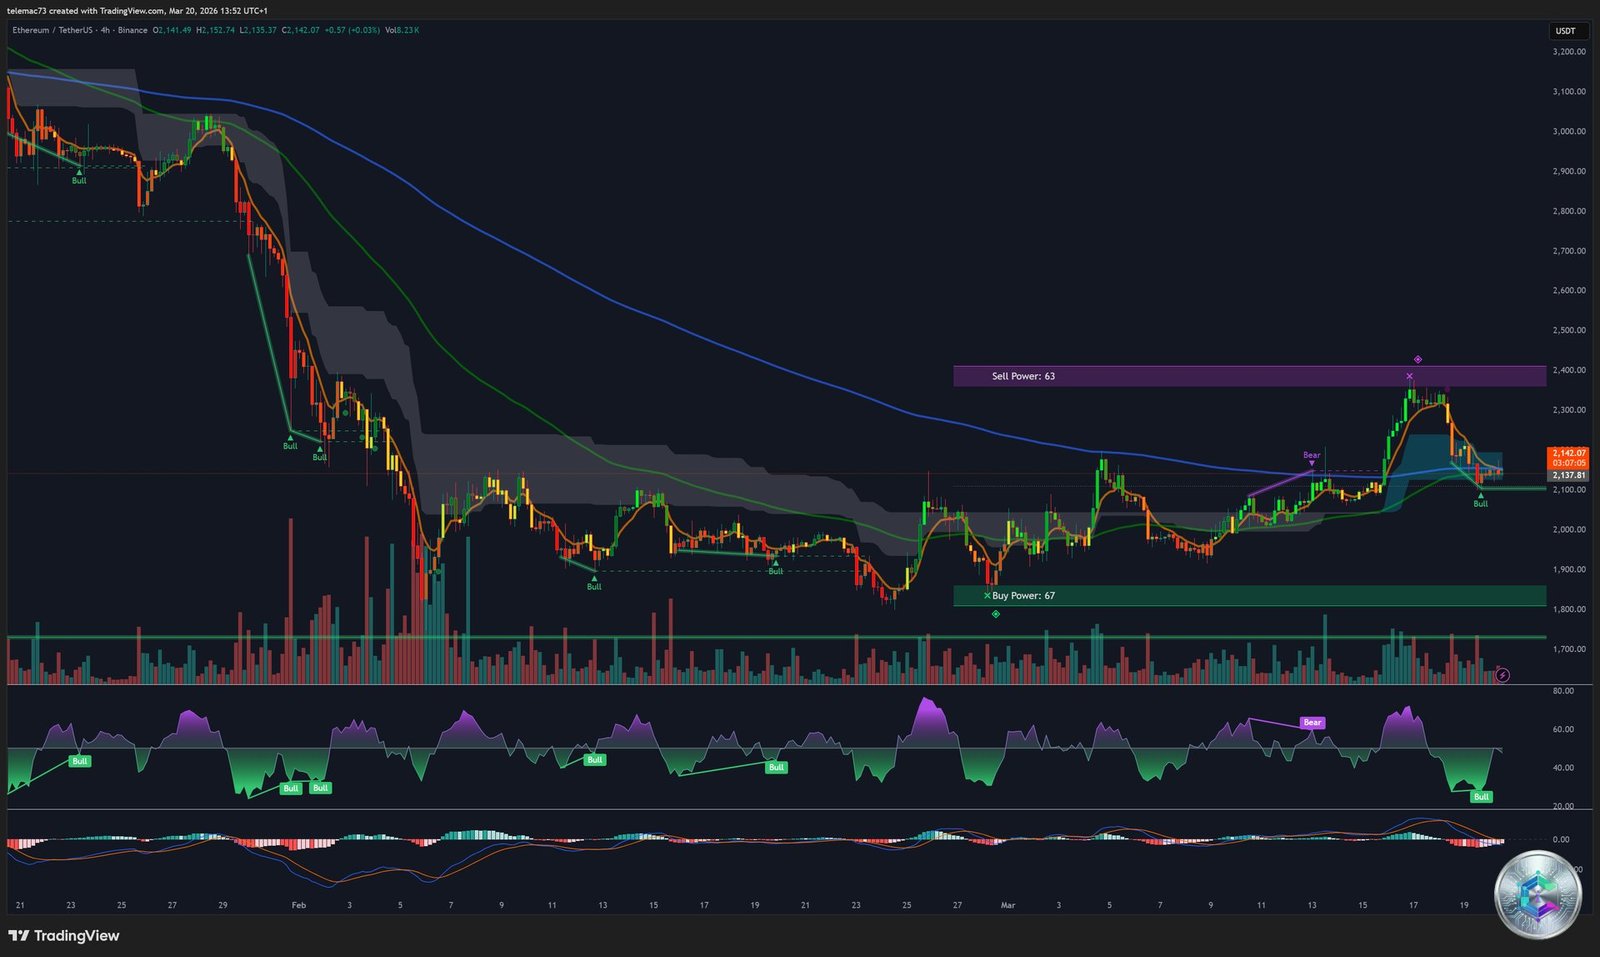
The 4H chart, with price at $2,142.07, reveals the most significant signal in this analysis: a RSI Bullish Divergence. During the last liquidation waves, price printed a new, deeper low — but the RSI instead inscribed a higher low. This mathematical divergence proves that the last bearish impulse was structurally weak, primarily driven by algorithmic stop hunting.
The 4H Ichimoku shows price consolidating just below the Kumo cloud, potentially preparing a bullish breakout. The immediate technical objective: neutralize the Sell Power at $2,400 and fill the CME Gap ($2,405–$2,665).
Micro View — 15-Minute Chart (15m)
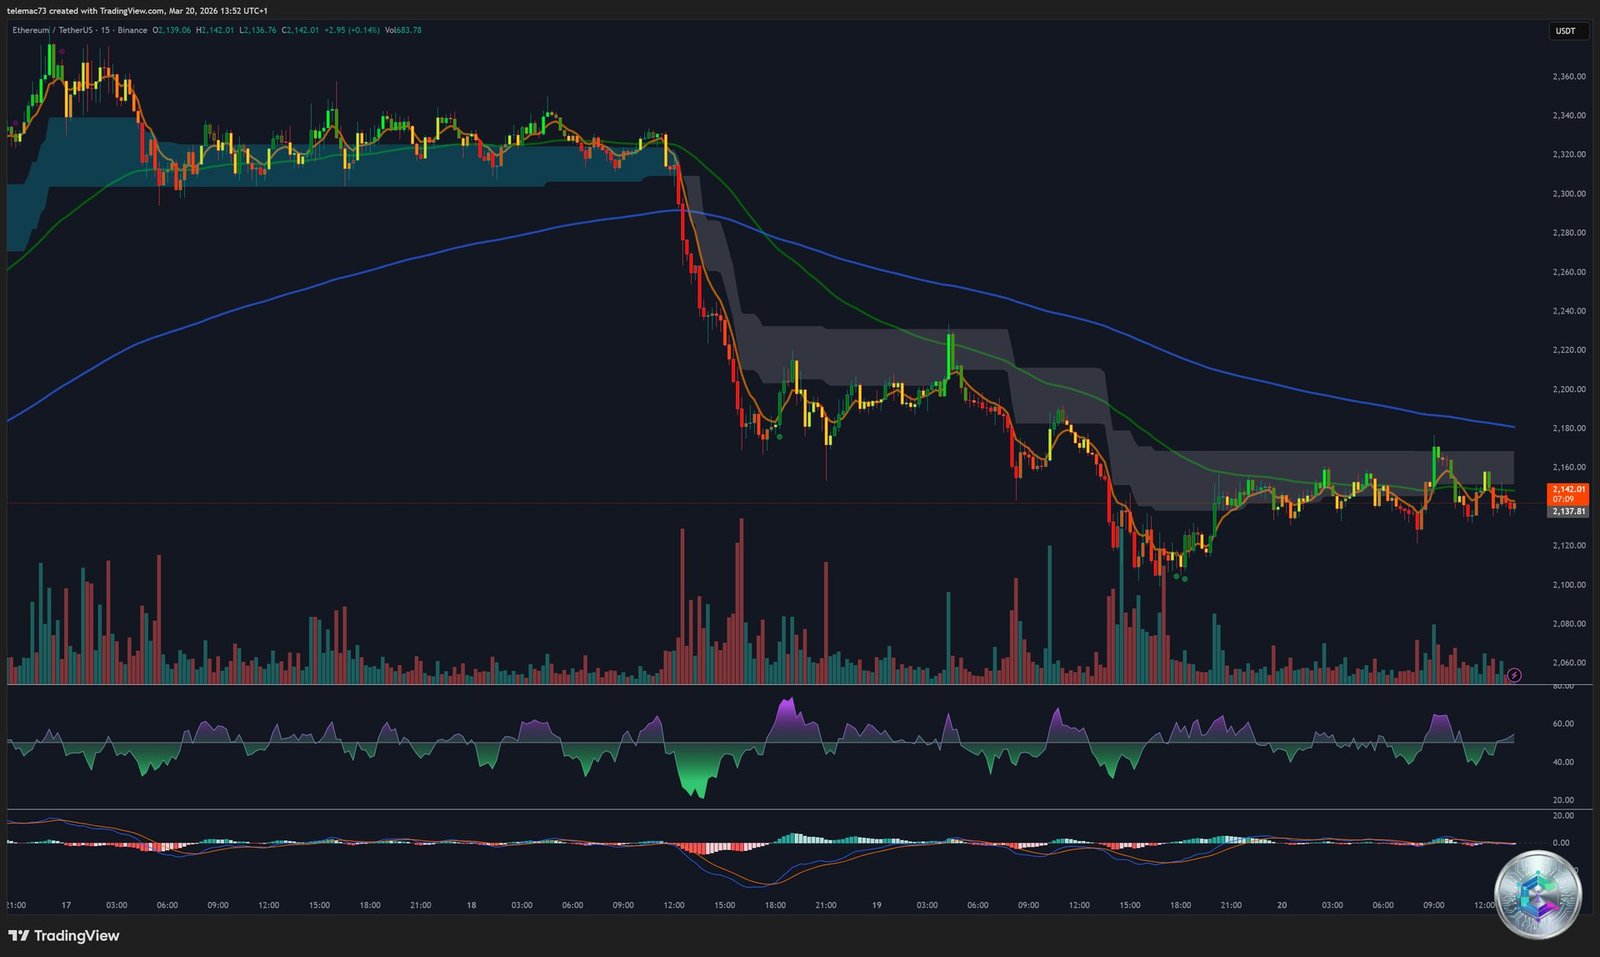
The 15-minute radiograph illustrates crypto market brutality: a vertiginous drop from $2,340 to $2,100 in just a few candles, with a massive volume spike signaling absorption by large players (buy the dip). The post-crash compression between SMA20 and SMA50 indicates a dramatic intraday volatility collapse — the calm before the storm. The Chande Kroll Stop indicator delimits the pivot zone between $2,023.70 (support) and $2,268.90 (resistance).
Strategic Price Level Matrix
| Price Level ($) | Classification | Justification |
|---|---|---|
| $7,500 – $12,000 | 🎯 Long-Term Target (2026/2027) | Standard Chartered institutional target post-Fusaka; PayFi & ETF growth |
| $3,400 – $3,600 | 🔴 Macro Resistance / Distribution | Sell Power:68 zone (1D). Full Bear Market invalidation level |
| $2,773 – $2,956 | 🔴 Critical Dynamic Resistance | SMA50 + SMA200 confluence (Death Cross). Triangle upper resistance |
| $2,405 – $2,665 | 🧲 CME Gap / Algorithmic Magnet | Unfilled CME futures market inefficiency — mathematical price attraction |
| $2,358 – $2,400 | ⚡ Short Squeeze Trigger | Sell Power:63 (4H). Breakout = $234M–$990M short liquidation cascade |
| $2,138 – $2,150 | ⚖️ Current Pivot (Hinge Level) | Balance point — price center of gravity as of March 20, 2026 |
| $2,043 – $2,050 | 🟡 Intermediate Support | Daily Bollinger Band lower boundary (%B: 0.067) |
| $1,886 – $1,960 | 🚨 Alarm Zone / Long Squeeze | Breakdown = $667M cascading long liquidations |
| $1,600 – $1,800 | 🟢 Absolute Structural Floor | Buy Power:62 (1D). Defended by whales + 30.5% staked supply |
Probabilistic Modeling: The 3 Scenarios
🟢 Primary Bullish Scenario — The Supply Shock (Dominant Probability)
An upside resolution of the daily symmetrical triangle remains the preferred scenario. The formation of a Higher Low around the $2,138 pivot, supported by ETF accumulation flows (3.8% of supply absorbed) and staking (30.5% locked), would initiate the recovery. The breakout above $2,358–$2,400 would trigger the Short Squeeze ($234M–$990M in short positions liquidated), aspirating price to fill the CME Gap ($2,405–$2,665).
Once $3,000 is breached, Fusaka’s deflationary effects will be fully reflected in the valuation. Target trajectory: $4,200–$5,000 by end of summer 2026, with a year-end target of $7,500 (Standard Chartered projections).
🔴 Alternative Bearish Scenario — Liquidation Cascade
This minority-probability scenario would be triggered by an exogenous shock: aggressive Fed tightening, major geopolitical tensions, or an unexpected regulatory roadblock. A breakdown below $1,960–$1,886 would trigger a cascading liquidation of $667 million in long positions, sending price toward the structural floor of $1,600–$1,800. However, the solidity of on-chain fundamentals would guarantee this low is aggressively bought, marking the final purge before the secular bull market.
🟡 Sideways Consolidation Scenario — Transitional Lethargy
Institutional accumulation continues over-the-counter without moving spot price. ETH remains trapped in its symmetrical triangle, oscillating between $2,043 and $2,773 for several months, until internal supply shock pressure mechanically breaks the upper triangle resistance — likely by Q3 2026.
Conclusion: A Generational Accumulation Window
The holistic analysis of Ethereum in March 2026 reveals an asset navigating one of the most intense compression phases in its history. The short-term chart structure remains under pressure (Death Cross, oversold RSI, Extreme Fear sentiment). But extrapolating these short-term bearish signals would be a fundamental misreading.
The true underlying architecture — 30.5% of supply staked, sustained ETF absorption, Fusaka’s deflationary effects, imminent global liquidity rotation post-Russell 2000 breakout — is preparing a violent supply shock. The $1,600–$2,150 zone represents, according to quantitative models, a market inefficiency offering an asymmetric generational accumulation window. The resolution of the current compression will, by all statistical probability, be directionally explosive and fundamentally bullish.
⚠️ Important Disclaimer: This article is written for educational and informational purposes only. It does not constitute investment advice, a recommendation to buy or sell, or an inducement to conduct transactions in financial assets or cryptocurrencies. Cryptocurrency markets are extremely volatile and carry risks of total capital loss. Before making any investment decision, consult a qualified professional financial advisor. Past performance is not indicative of future results.