
As of March 20, 2026, Bitcoin stands at a historic crossroads. After printing local highs above $74,000 — driven by eight consecutive bullish sessions, a sequence unseen since October 2025 — the asset is now consolidating in a critical corridor between $69,000 and $71,000. This comprehensive analysis dissects the conflicting forces shaping this market: macroeconomic shocks, a regulatory landmark, on-chain signals, and multi-timeframe technical cartography.
1. Macroeconomic Environment: The Inflation / Rates / Geopolitics Trilemma
The Federal Reserve’s « Hawkish Hold » Shock
March 18, 2026 will be remembered as a pivotal date for markets. The U.S. Producer Price Index (PPI) surged to 3.4% year-over-year, blindsiding a consensus forecast of 2.9%. This figure seriously jeopardizes any near-term return to the Fed’s 2% target and forces the institution into a more restrictive monetary stance than markets had priced in.
In response, the FOMC held its target rate in the 3.50%–3.75% range. While the hold itself was expected, it was the revised Dot Plot that rattled markets: the median projection now points to only one rate cut in 2026, down from two previously anticipated. More alarmingly, seven of the nineteen Fed officials now project zero cuts for the year. The 10-year U.S. Treasury yield tightened to ~4.206%, reinforcing Bitcoin’s opportunity cost.
| Indicator | Value (March 2026) | BTC Impact |
|---|---|---|
| PPI (USA) | 3.4% (vs 2.9% expected) | ⬇️ Negative |
| FOMC Rate | 3.50%–3.75% | ⬇️ Restricted liquidity |
| Dot Plot 2026 | Only 1 cut projected | ⬇️ Bull cycle delayed |
| US 10Y Yield | ~4.206% | ⬇️ High opportunity cost |
| Crude Oil | Strong upside volatility | ↔️ Mixed |
Geopolitics: The Energy Shock Specter
Escalating Middle East tensions — with explicit threats to the Strait of Hormuz — have injected a massive risk premium into energy markets, fueling inflation fears explicitly cited by Fed Chair Jerome Powell at his press conference. Paradoxically, when the S&P 500 fell 0.61% on Iranian news, crypto markets absorbed a net $120 billion liquidity injection in 24 hours, highlighting Bitcoin’s growing role as a geopolitical hedge alongside physical gold.
2. Regulatory Landmark: The Historic SEC/CFTC Taxonomy
March 17, 2026 marks a watershed moment in digital finance history. The SEC and CFTC jointly published a comprehensive interpretation establishing a clear taxonomy for crypto assets, ending a decade of « regulation by enforcement. » The framework divides the digital asset universe into five categories:
- Digital Commodities — including Bitcoin (BTC), formally classified as a digital commodity under CFTC jurisdiction (non-security).
- Digital Collectibles — NFTs for art, collection, or entertainment with no financial return promise.
- Digital Tools — utility tokens acting as licenses, identifiers, or access passes.
- Payment Stablecoins — fiat-pegged currencies subject to the GENIUS Act.
- Digital Securities — traditional financial instruments natively issued on a blockchain.
This clarification represents a fundamental long-term bullish catalyst of exceptional magnitude. It removes the regulatory sword of Damocles that had been hanging over the industry, enabling frictionless Bitcoin integration into corporate balance sheets, pension funds, and sovereign portfolios. The parallel advancement of the CLARITY Act in the Senate further cements this framework.
3. Market Microstructure: Order Book Liquidity Heatmap
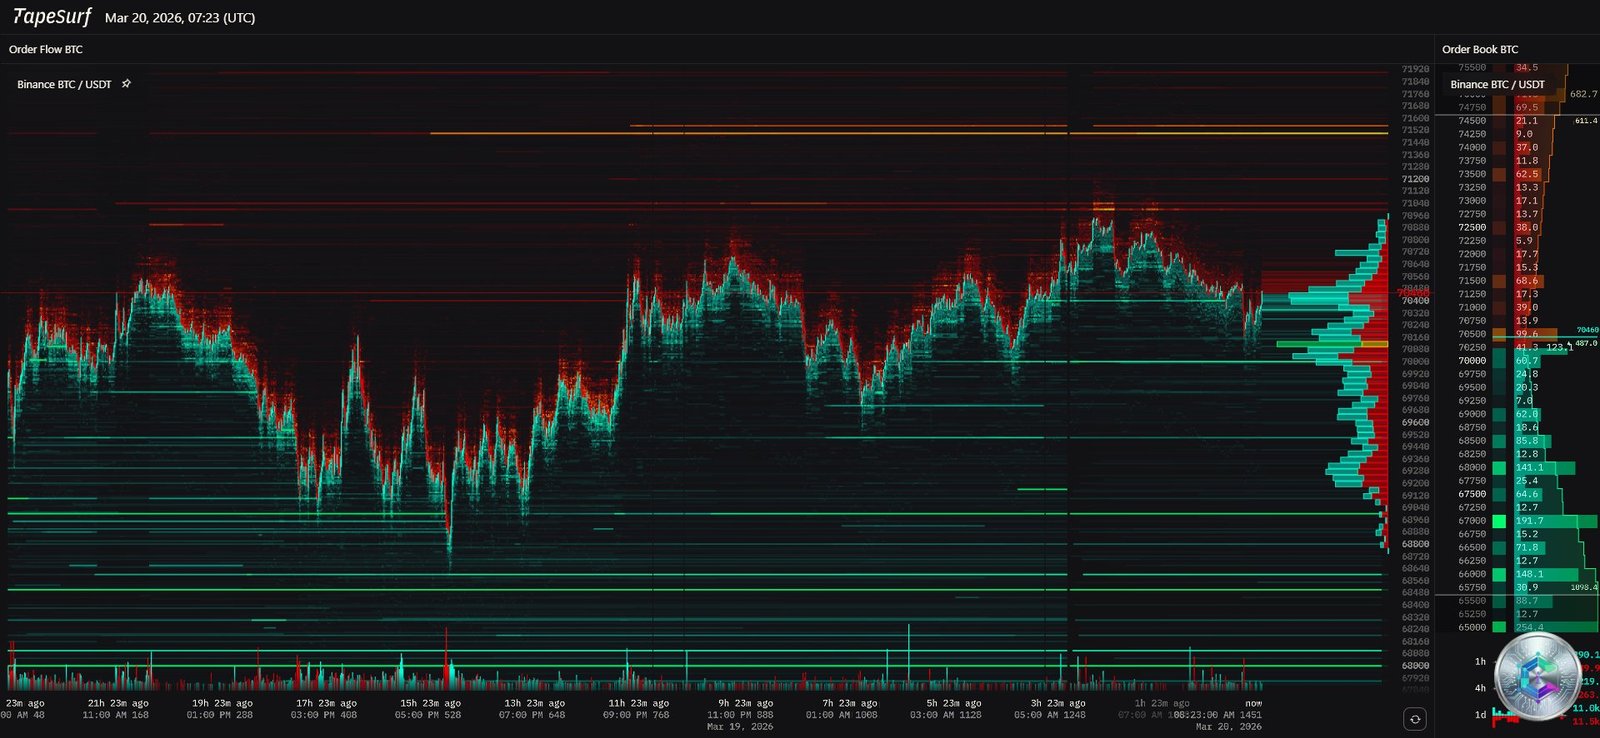
A deep dive into the order book reveals an intense positioning battle:
- Sell Wall ($74,000–$76,000): Dense red lines materializing a massive « Gamma Cluster » and short liquidation zones. Breaching this level requires sustained buying pressure and a major macro catalyst.
- Bid Wall ($68,000–$69,500): Thick green bands signaling systematic institutional buy orders — likely tied to Spot ETF issuers and entities like MicroStrategy (average cost basis: ~$70,946).
- Thin Liquidity Pocket ($70,000–$72,000): High-volatility zone; absence of large orders generates rapid, erratic price movements during macro releases.
| Zone | Level ($) | Characteristic | Likely Consequence |
|---|---|---|---|
| Extreme resistance | 82,000–85,000 | Macro-bullish target | Very long-term attraction |
| Sell Wall (Gamma Cluster) | 74,000–76,000 | Intense Ask Wall | Systematic rejection |
| Liquidity void | 70,000–72,000 | Thin volume profile | High volatility / rapid transit |
| Buy Wall (Support) | 68,000–69,500 | Thick Bid Wall | Panic sell absorption |
| Bearish liquidation target | 63,000–65,600 | Institutional stop-losses | Landing zone in macro shock |
4. On-Chain Analysis: Retail vs. Institutional Divergence
Blockchain metrics reveal a counter-intuitive reality: despite historically high prices, small holders (under 10 BTC) are engaged in aggressive distribution. The Fear & Greed Index hovers in « extreme fear » territory (15–28/100). Conversely, institutional players are holding the line:
- MicroStrategy recently added over 22,000 BTC, bringing its total treasury to 738,731 BTC (average cost: $70,946).
- A wallet dormant for 13.2 years moved 909.38 BTC (~$84.6M), originally acquired at under $7. The movement likely signals OTC settlement preparation rather than direct market dumping.
- An OG whale identified as Owen Gunden transferred 650 BTC to Kraken (~$45M) in a geopolitical de-risking move.
Meanwhile, whales are quietly accumulating high-beta altcoins (ETH, BCH, UNI, LINK), anticipating a compression of Bitcoin dominance (currently at 58.8%) in favor of an « alt-season. »
5. Multi-Timeframe Technical Analysis
Daily Chart — The Macro Structure
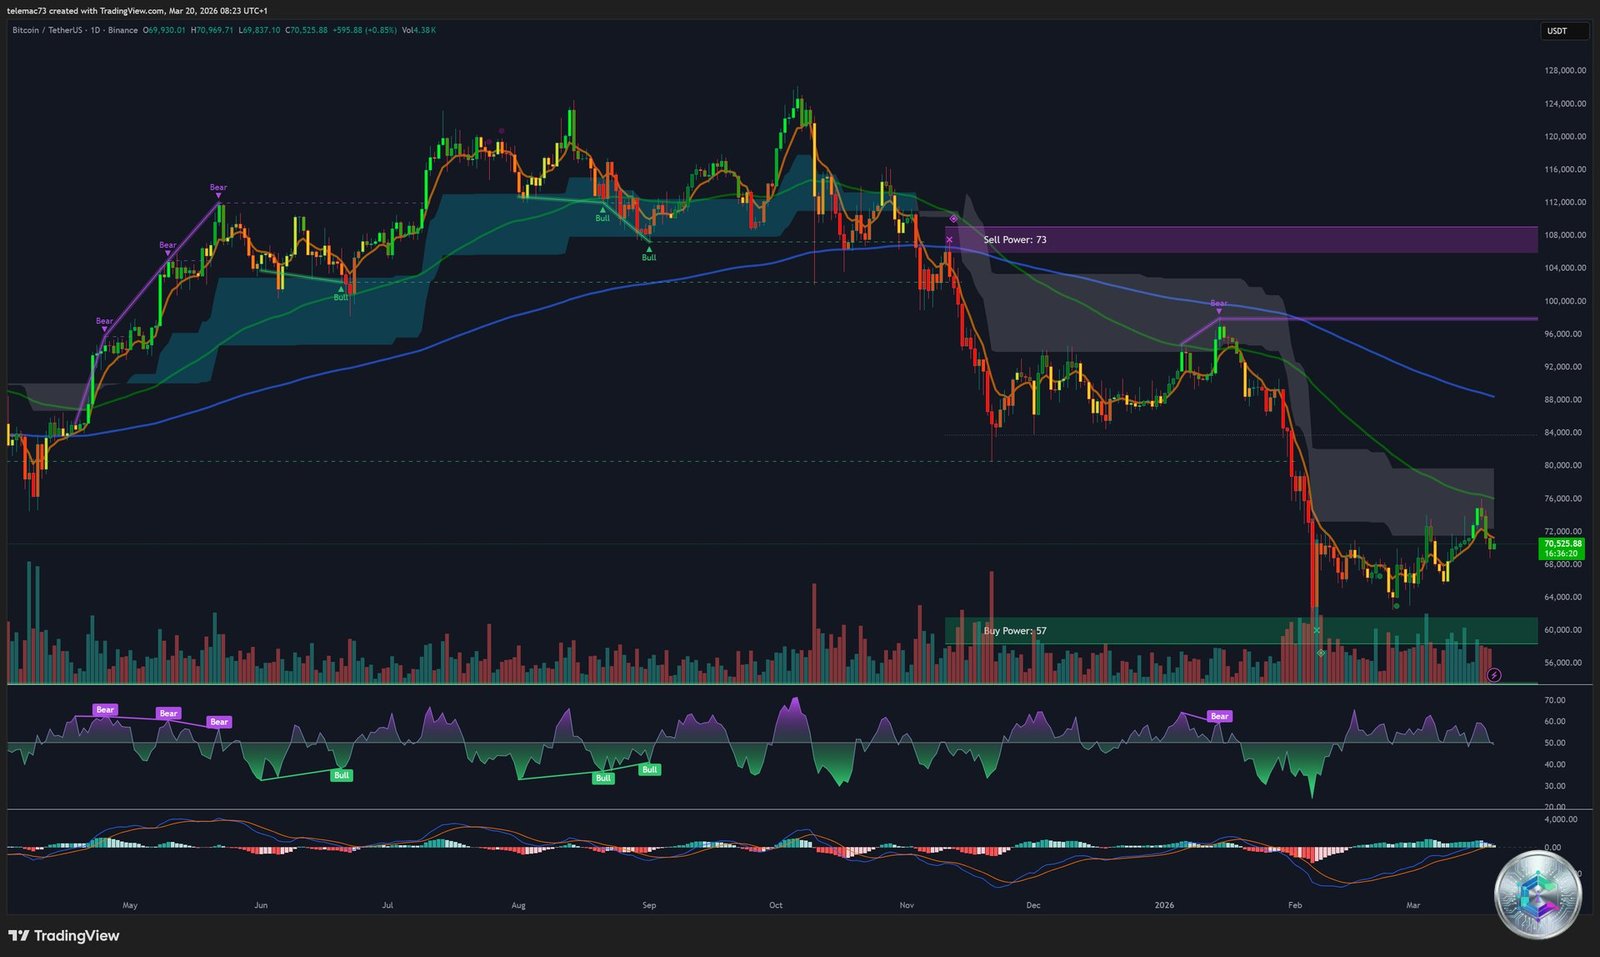
The daily chart reveals an asset in distribution-consolidation after a parabolic expansion. Price (~$70,525) is trapped between two fundamental anchors: the Realized Price at ~$54,900 (long-term floor) and the True Market Mean at ~$79,000 (global resistance). The 50-day SMA ($71,127–$71,500) serves as the medium-term bull/bear demarcation line. RSI oscillates in neutral territory (52–59) while the MACD shows bearish predominance, confirming contracting momentum.
| Technical Level | Price ($) | Interpretation |
|---|---|---|
| Max bullish target (R2) | 77,600–79,000 | True Market Mean / Major breakout |
| Intermediate resistance (R1) | 74,712–76,000 | Fib 0.382 / Options wall |
| Intraday pivot | 73,200 | Short-term sentiment gauge |
| Dynamic support (50-DMA) | 71,127–71,500 | MT bull/bear demarcation |
| Critical support (S1) | 69,028 | Fib 0.236 — must-hold floor |
| Macro demand zone | 63,000–65,600 | February lows / Major bearish landing |
4-Hour Chart — The Compression Triangle
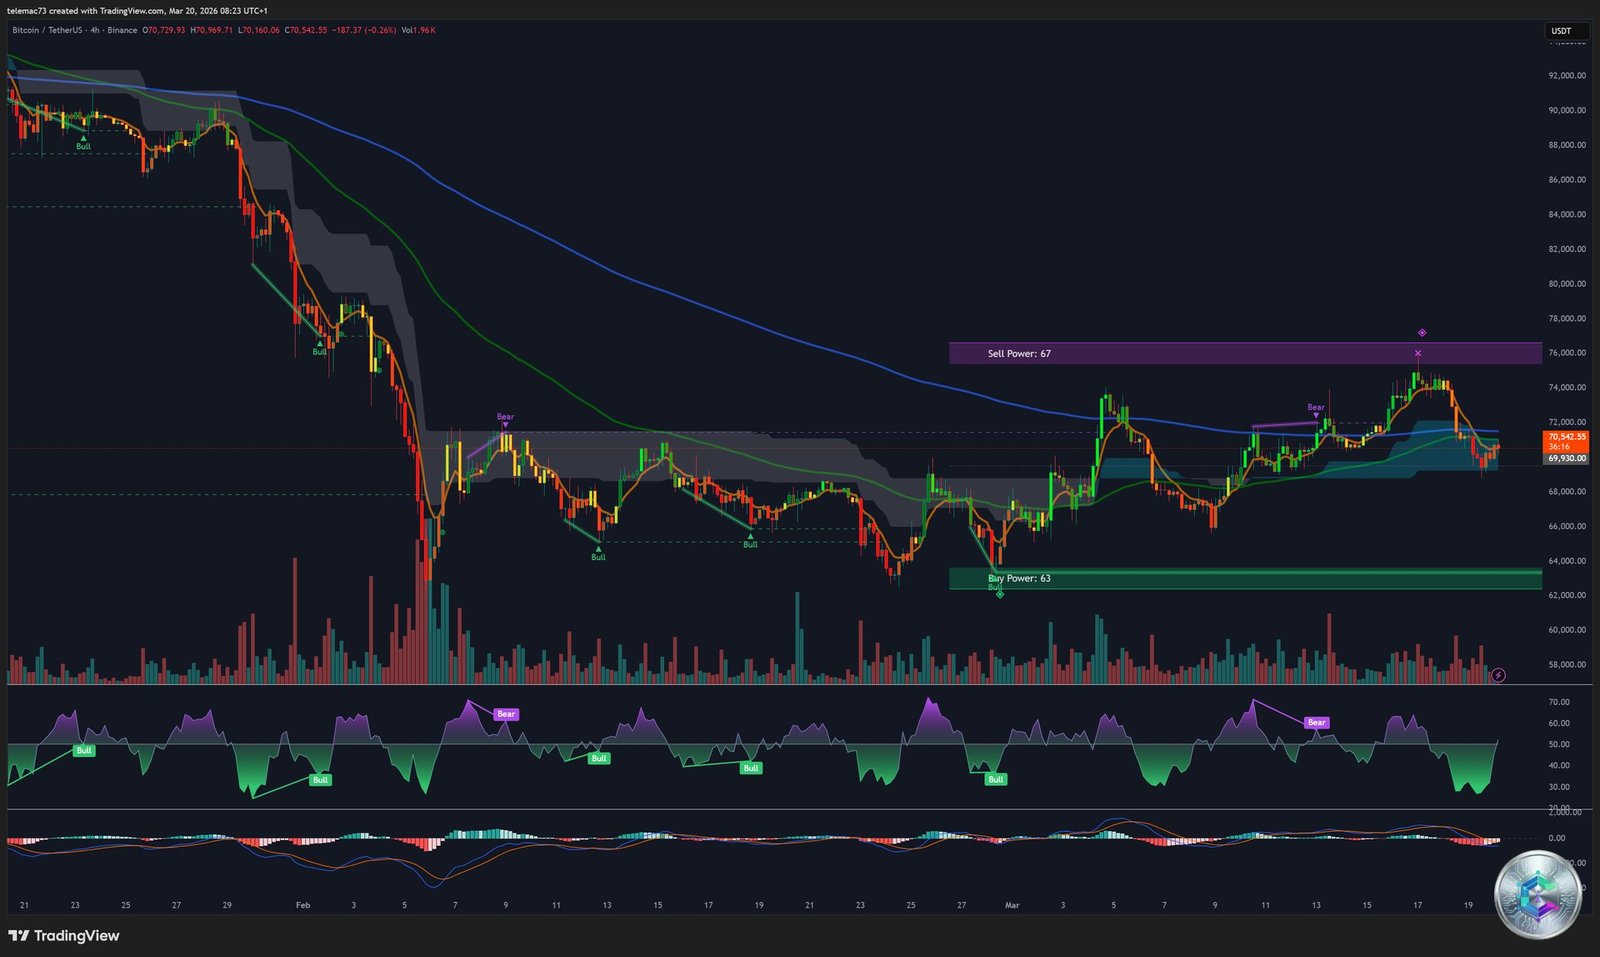
The 4H chart depicts a suffocating market. Price action is forming a tightening compression triangle: price (~$70,542) is caught between a descending dynamic resistance and ascending support. This volatility squeeze is the classic signature of energy accumulation preceding an explosive breakout. The MACD shows signs of a local « Death Cross » if support breaks, while RSI is printing lower highs — a hidden bearish divergence betraying buyer weakness at each rebound.
15-Minute Chart — The Algorithmic Noise Floor
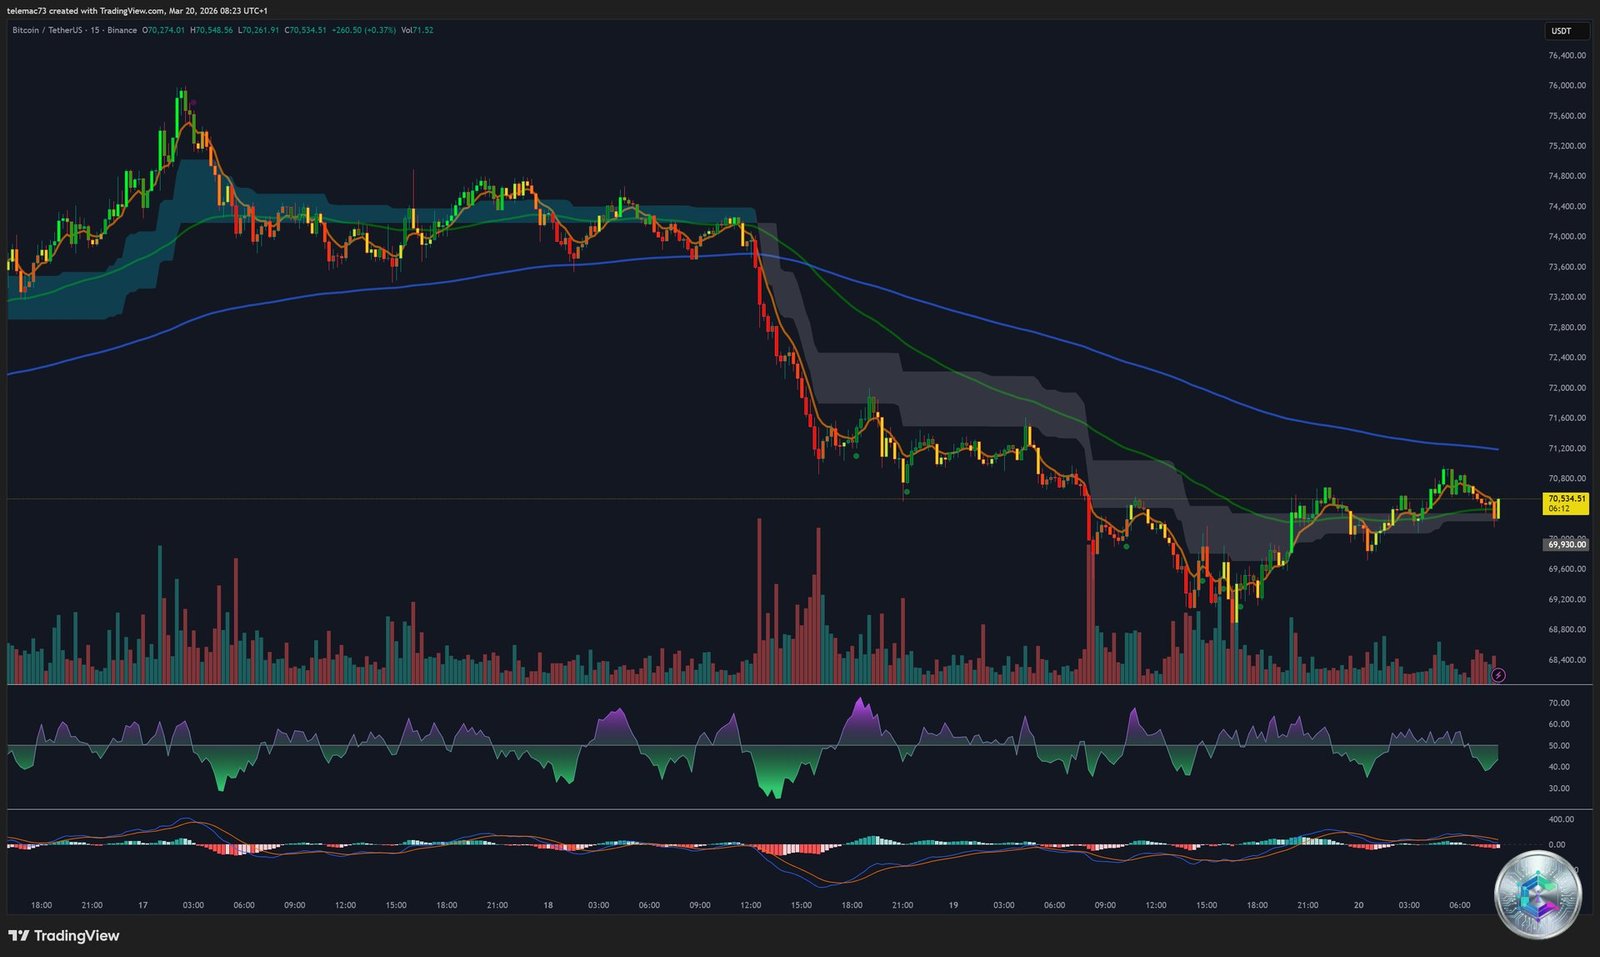
On the 15-minute timeframe, the market belongs to HFT algorithms and macro front-running. Price weaves through a razor-thin trend cloud — total absence of sustained directionality. Sporadic red volume spikes reflect sudden block-selling or cascading stop-loss liquidations. The $74,000 level acts as an impenetrable ceiling on this timeframe; every incursion quickly forms a micro « Bear Flag, » confirming that a directional move requires a confirmed close above resistance to invalidate the algorithmic sell bias.
6. Market Scenarios and Strategic Projections
| Scenario | Probability | Trigger | BTC Target ($) | Altcoin Impact |
|---|---|---|---|---|
| 🟡 Base (Lateral range) | 55% | FOMC digestion, institutional balance | 68,500–72,000 | Slow rotation to ETH/SOL |
| 🔴 Bearish (Macro flush) | 25% | Inflationary shock, tightened rates | 63,000–65,600 | Massive liquidity dry-up |
| 🟢 Bullish (Short squeeze rally) | 20% | Break above $74K, geopolitical narrative | 78,000–80,000 | High-beta altcoins outperform |
Base scenario (55%): The market digests contradictory information in a $68,500–$72,000 range. ETF buyers absorb retail and historic whale selling. A sector rotation toward altcoins (Solana, ETH) is likely.
Bearish scenario (25%): Geopolitical deterioration triggers an oil shock, forcing the Fed to abandon its single projected 2026 cut. A daily close below $69,028 would trigger an algorithmic cascade toward $63,000–$65,600.
Bullish scenario (20%): The market fully prices in the SEC/CFTC regulatory clarity. The 4H compression triangle resolves upward, triggering a massive short squeeze toward $78,000–$80,000 on expanding volume.
Conclusion
Bitcoin in March 2026 embodies a fascinating duality: unprecedented institutional and regulatory maturity — culminating in the definitive « Digital Commodity » classification — coexists with full exposure to the unforgiving gravity of global macroeconomics. The next major directional expansion, whose precursors are readable in the multi-timeframe compression triangles and order book tension, will hinge on institutional buyers’ capacity to absorb latent supply at the 50-day SMA. A decisive close above $74,500 would entirely redefine the valuation ceiling for Bitcoin in the second half of 2026.
⚠️ Disclaimer: This article is written for educational and informational purposes only. It does not constitute investment advice or a recommendation to buy or sell any financial or digital assets. Cryptocurrency markets are highly volatile and carry a risk of total capital loss. Please consult a qualified financial advisor before making any investment decision.