
Introduction: A Market Under Extreme Compression
As of Wednesday, March 18, 2026, Bitcoin (BTC) is oscillating within an exceptionally tight consolidation zone, hovering around the critical threshold of $74,000–$74,500, after recently testing — and briefly breaching — the major psychological resistance of $75,000. Bitcoin’s total market capitalization now exceeds $1.37 trillion, representing a dominant 56.69% share of a global crypto market valued at over $2.61 trillion.
This report offers an exhaustive, multidimensional analysis of the Bitcoin market, integrating the macroeconomic landscape, institutional capital flows, multi-timeframe chart analysis, and order book microstructure.
🌍 Macroeconomic Context: The Stagflation Threat
Energy Crisis and Inflationary Shock
Geopolitical tensions in the Middle East — including strikes targeting Iranian strategic infrastructure and a near-closure of the Strait of Hormuz — have kept Brent crude oil prices persistently above $100 per barrel. This exogenous supply shock is generating systemic inflationary pressure across global supply chains, reigniting fears of a stagflation scenario (stagnant growth + persistent inflation).
Forecasting models now suggest that the U.S. Core PCE inflation — the Fed’s preferred gauge — could be revised upward from 3.0% to a range of 3.2%–3.3%. Against this backdrop, Bitcoin is demonstrating remarkable resilience, beginning to partially decouple from traditional equity indices like the S&P 500, and increasingly being used as a non-sovereign hedge against fiat currency debasement.
FOMC: The Central Macroeconomic Catalyst
The FOMC meeting of March 17–18, 2026 represents the absolute focal point of this market period. Federal Funds futures price in a 99% probability that the Fed will hold rates unchanged in the restrictive range of 3.75%–4.00%.
Since the rate decision is fully priced in, all eyes turn to the Dot Plot and Jerome Powell’s press conference rhetoric:
- Hawkish scenario (downward revision of expected rate cuts) → short-term liquidation across BTC and risk assets.
- Dovish scenario (acknowledging labor market deterioration) → powerful bullish catalyst, potential breakout beyond $76,000.
⚖️ Regulatory Revolution: The SEC Reclassifies Bitcoin
March 17, 2026 will be remembered as a historic milestone for the digital asset industry. The SEC and CFTC jointly released a comprehensive 68-page guidance document, ending over a decade of legal ambiguity.
Under new chairman Paul Atkins, the SEC officially declared that Bitcoin, Ethereum, and the vast majority of leading cryptocurrencies do not meet the criteria of the 1946 Howey Test. These assets are now formally recognized as « digital commodities », falling primarily under CFTC jurisdiction.
The concrete implications of this reclassification are seismic:
- Lifting of institutional barriers — Major banks, pension funds, and Tier 1 custodians can now integrate BTC into their balance sheets with full legal clarity.
- Blockchain infrastructure protection — Proof-of-Work mining, staking, and airdrops are explicitly excluded from securities regulation.
- Jurisdiction transfer to the CFTC — A regulator historically known for its more pragmatic, market-integrity-focused approach.
By eliminating the existential risk of prolonged federal litigation, this directive unlocks a new wave of long-horizon institutional capital into Bitcoin.
🏦 Institutional Flows and Supply Asymmetry
Spot Bitcoin ETFs: Record Demand
U.S. spot Bitcoin ETFs are recording their 7th consecutive day of positive net inflows, accumulating $1.17 billion over the past week alone. On Tuesday, March 17, BlackRock’s IBIT alone captured $169 million in net inflows, followed by Fidelity’s FBTC with $24.4 million.
This marks the longest uninterrupted positive streak since October 2025, signaling a powerful return of institutional conviction.
Strategy Inc. and Whale Accumulation
Strategy Inc. (formerly MicroStrategy) acquired between 17,000 and 22,337 additional BTC in March, bringing its total reserves to approximately 761,068 BTC (≈ $57.6 billion), at an average cost basis of $75,696 per BTC.
On-chain data further reveals that wallets holding between 10 and 10,000 BTC now control approximately 68% of total circulating supply, confirming a systemic hoarding (hodling) phase where liquid supply is critically tightening.
| Entity | Flow / Metric | Period | Market Impact |
|---|---|---|---|
| US Spot ETFs (Global) | +$1.17B net inflows | Last 7 days | Continuous inelastic buying pressure |
| IBIT (BlackRock) | +$169M net | March 17, 2026 | Aggressive liquidity absorption |
| Strategy Inc. | +17k–22k BTC | Mid-March 2026 | Strong conviction signal; permanent supply removal |
| Whales (10–10k BTC) | 68% of total supply | March 2026 | Drastic reduction in potential sell-side pressure |
🔥 Market Microstructure: Heatmap & Order Book Analysis
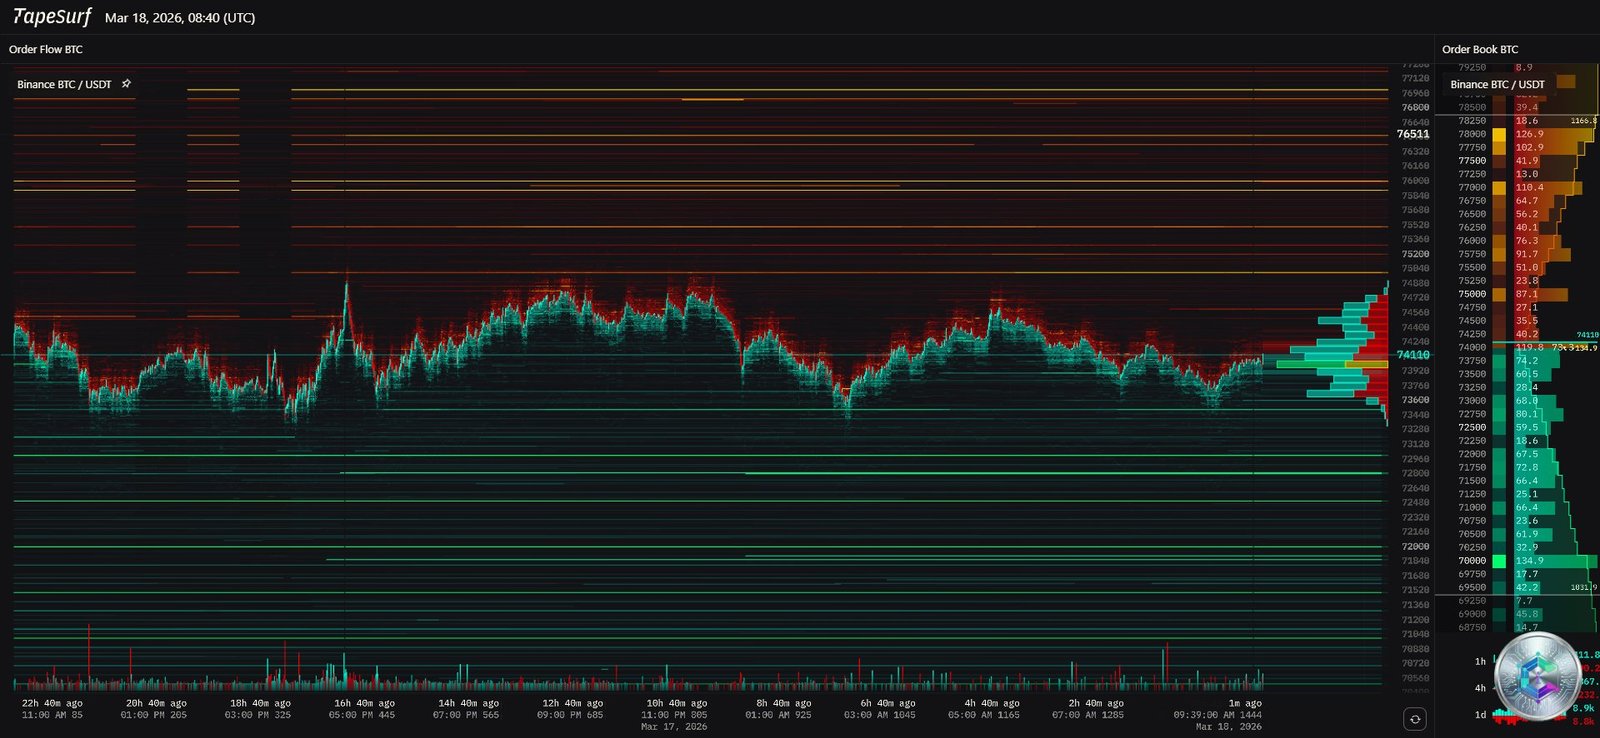
The heatmap analysis reveals a striking asymmetry in liquidity distribution:
Sell Wall: $74,500–$76,500
On the supply side, a dense cluster of limit sell orders (red/orange bands) thickens considerably between $74,500 and $76,500. This zone coincides with a massive liquidation cluster of short positions. The recent incursion toward $75,000 has already triggered approximately $124 million in short squeezes. A sustained breakout above this zone would open a liquidity vacuum toward $80,000.
Defensive Supports Below
Below the current price, the support structure is more fragmented. In the event of an unexpected negative macro shock, BTC could traverse the $70,000–$73,000 range with minimal friction. The true institutional defensive trenches are located at:
- $68,288–$68,987: Fibonacci retracement 0.236
- $61,530–$64,560: Major macro-structural accumulation zone (key historical support)
📊 Multi-Timeframe Chart Analysis
Daily Chart (1D): Golden Cross and Bullish Structure
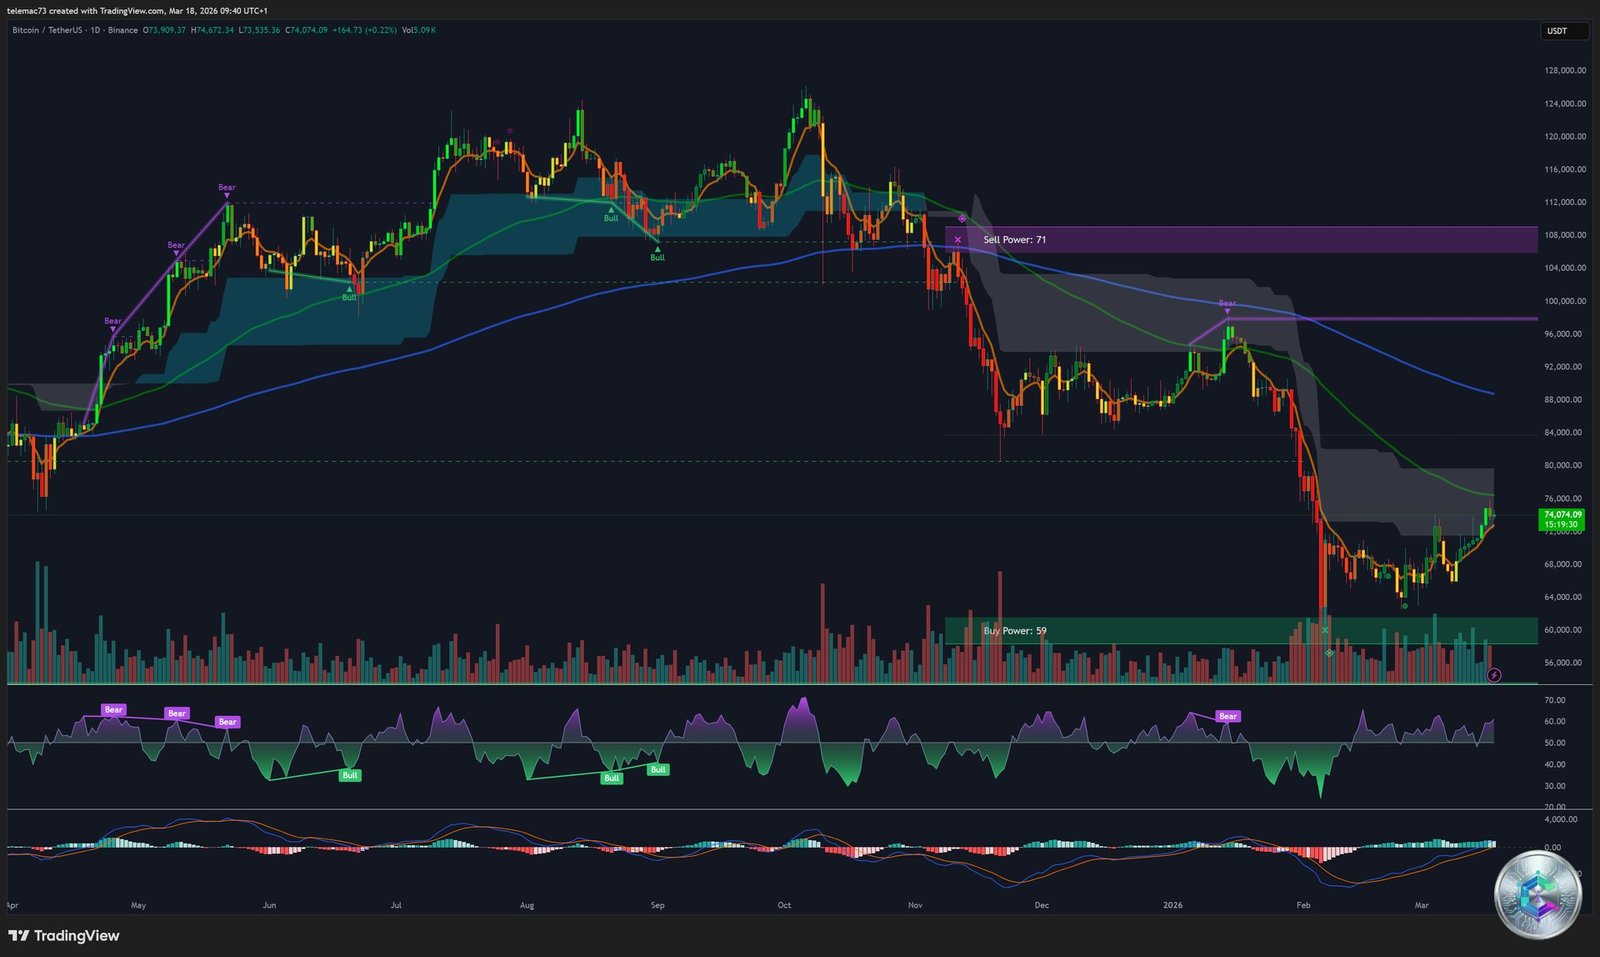
The daily chart presents an unambiguously bullish macro structure:
- Confirmed Golden Cross: The MA50 (~$73,805–$74,129) trades well above the MA200 (~$71,630–$71,974), invalidating any systemic bear market scenario.
- Bullish breakout: Price has broken a major downtrend line to the upside and is printing the classic Dow Theory sequence of Higher Highs / Higher Lows.
- RSI (14) at 46–54: Absolute neutrality — prior overheating has been purged through lateral consolidation, offering a clean technical « runway » for the next move.
- Stochastic (9,6) at 99.01: Extreme overbought — the signature of a strongly trending market where every micro-dip is immediately bought by institutions (embedded stochastic).
- Daily MACD: Clean bullish crossover with histogram extending into positive territory.
Daily Pivot Points Table
| Level | Price Zone (USD) | Interpretation |
|---|---|---|
| R3 (Resistance 3) | $74,655–$75,092 | Extreme buyer exhaustion zone |
| R2 (Resistance 2) | $74,475–$74,891 | Liquidation cluster (heatmap confirmed) |
| R1 (Resistance 1) | $74,203–$74,641 | First significant supply zone |
| PP (Central Pivot) | $74,035–$74,486 | Current market center of gravity |
| S1 (Support 1) | $73,764–$74,331 | First institutional demand wall |
| S2 (Support 2) | $73,596–$74,236 | Critical intraday support |
| S3 (Support 3) | $73,336–$73,878 | Invalidation of local bullish structure |
4-Hour Chart (4H): Volcanic Compression
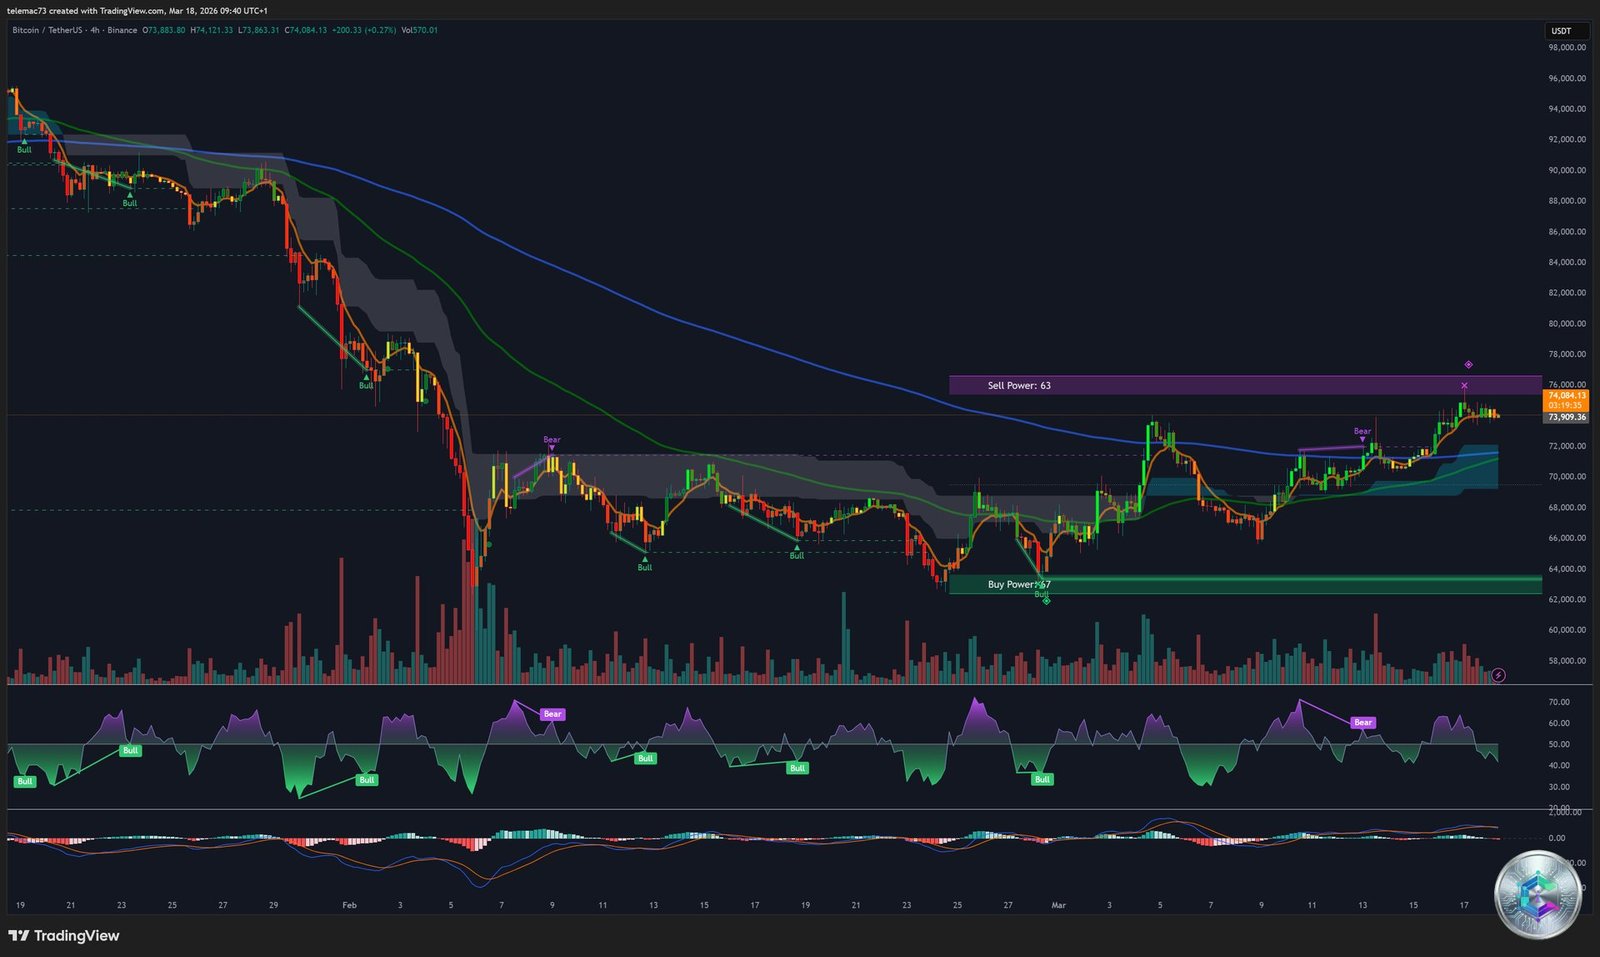
On the 4H timeframe, price is compressed beneath the purple « Sell Power » resistance band. The price action from the lows has formed a classic Bull Flag / Ascending Compression Triangle:
- Bears are attempting to defend $75,000 but consistently fail to drive price deeply lower.
- Bulls are patiently absorbing all available supply, printing successive Higher Lows.
- The contracted ATR (volatility at historical lows): this is the calm before the storm. The FOMC is the perfect ignition spark.
- A confirmed bullish breakout would trigger a massive short squeeze cascade toward $79,000–$80,000.
15-Minute Chart (15M): The Algorithmic Arena
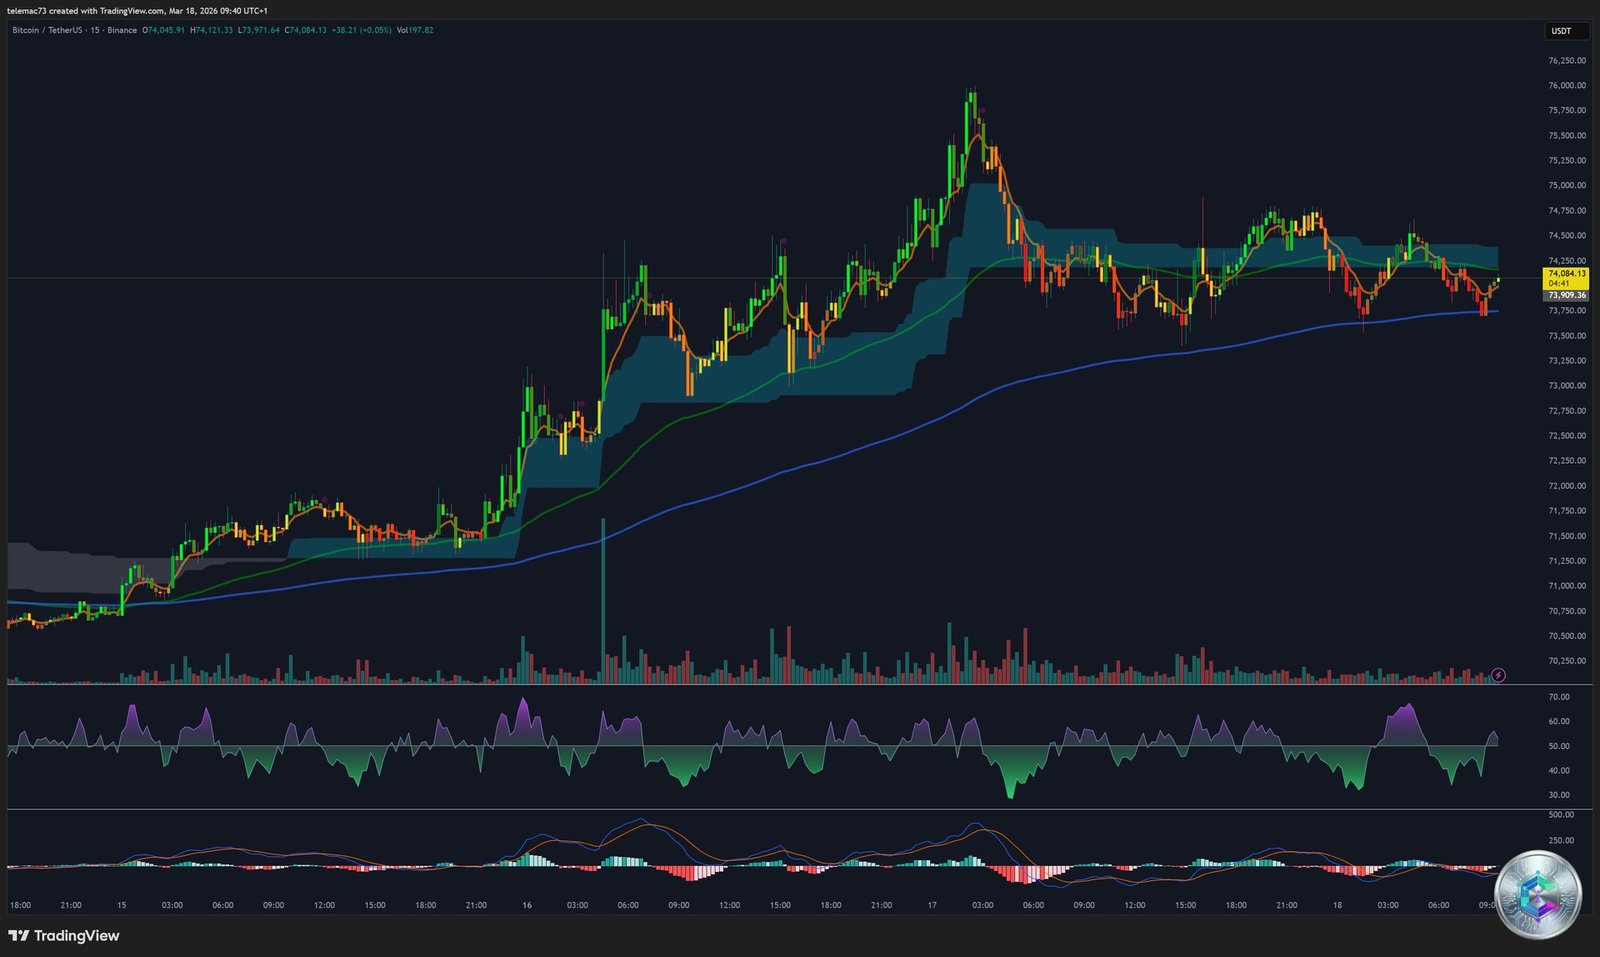
The 15M chart reveals a recent local bullish impulse that propelled price to a local high near $76,000, followed by a sharp rejection (liquidity hunting by market makers) and a pullback to $74,084. The 15M MACD shows a local bearish crossover with histogram dipping into negative territory — a signal of healthy consolidation, not structural reversal. This purging of local euphoria is setting the stage for the next genuine structural leg higher.
🧠 Market Psychology: The « Wall of Worry »
Sentiment metrics present a fascinating dichotomy: the Fear & Greed Index oscillates between 15 and 26 (« Extreme Fear »), while price holds comfortably above $74,000 — just a few percentage points from all-time highs.
This phenomenon — known in behavioral finance as the « Wall of Worry » — is the hallmark of the most durable bull markets. Excessive caution prevents irrational retail exuberance, giving institutional « smart money » the opportunity to accumulate discreetly. The hidden bullish divergence between extreme negative sentiment and resilient price action is a fundamental signal of methodical institutional accumulation.
🎯 Price Targets and 2026 Outlook
The convergence of technical, regulatory, institutional, and on-chain analysis supports the following forward projections:
- Short term: A confirmed breakout above $76,000 targets the Fibonacci 0.500 extension at $79,278, followed by the key psychological level of $80,000.
- Medium term (end of 2026): Institutional consensus anticipates a range of $120,000–$175,000.
- Standard Chartered maintains a firm price target of $150,000 for this market cycle’s peak.
- Maple Finance (Sidney Powell) projects $175,000, incorporating the mechanical impact of future Fed rate cuts.
- Optimal scenario (aggressive QE + ETF absorption + sovereign funds): select models push the upper bound to $225,000.
An additional structural driver: the Bitcoin-backed lending market is projected to reach $100 billion by end of 2026, permanently removing millions of BTC from exchange order books and placing them in cold storage custody as collateral — a sustained supply shock.
📌 Final Summary
As of March 18, 2026, Bitcoin is in a state of extreme mechanical compression, building colossal directional energy:
- ✅ Technically: Structural Golden Cross, Bull Flag beneath a marble-hard resistance, clean RSI runway.
- ✅ Regulatory: « Digital commodity » status officially enshrined, decade-long legal uncertainty removed.
- ✅ Institutionally: $1B+/week flowing through ETFs, whales controlling 68% of circulating supply.
- ⚡ Catalyst: The March 18 FOMC decision is the potential spark to detonate the $74,500–$76,000 sell wall.
The institutional floor of reinforced concrete sits below $68,000. The market is holding its breath — a predator coiled and ready — awaiting the final macroeconomic verdict from the U.S. central bank.
⚠️ Disclaimer
This article is published for informational and educational purposes only. It does not constitute investment advice, a recommendation to buy or sell, or any form of financial solicitation. Cryptocurrency markets are highly volatile and carry the risk of total capital loss. Any investment decision should be made only after consulting an independent, qualified financial advisor. CryptoInfo.ch bears no responsibility for decisions made based on the content of this article.