
Introduction: A Market at the Crossroads
In March 2026, the Bitcoin (BTC) market finds itself navigating an unprecedented period of analytical complexity. Pulled between divergent macroeconomic forces, escalating geopolitical tensions, US legislative paralysis, and highly contradictory technical signals, the flagship crypto asset stands at a genuine crossroads.
With the total crypto market capitalization at $2.51 trillion and Bitcoin dominance firmly held at 56.84%, the asset’s resilience in the face of headwinds is remarkable. The price is trading around $71,490, posting a notable recovery after intense selling pressure.
Yet beneath the surface of this rebound, market sentiment indicators paint a radically different picture. The Fear & Greed index recently plunged to a historically low level of 15 — a threshold of « extreme fear » — clashing violently with the asset’s nominal valuation. This divergence between price and sentiment forms the core of the current analytical dilemma.
⚡ Macroeconomic Context: The Middle East Geopolitical Shock
Bitcoin’s price dynamics throughout Q1 2026 have been intrinsically linked to exogenous shocks stemming from energy markets and global geopolitics. The escalation of tensions in the Middle East — involving direct military operations between the US, Israel, and Iran — served as a major stress test for the Bitcoin-as-safe-haven thesis.
Inverse Correlation with Energy Markets
The initial military announcements triggered a flight-to-liquidity response, causing a sharp Bitcoin selloff that briefly dipped below $65,000, touching $63,177 during panic peaks. Simultaneously, crude oil surged to local highs of $119 per barrel, fueling fears of an inflationary resurgence and a prolonged « higher for longer » Fed regime.
However, Bitcoin’s resilience proved asymmetric. Despite the initial liquidation, the asset registered a 6–6.5% gain since the onset of the geopolitical crisis at end of February, outperforming traditional equity markets (S&P 500: -1.42%, Nasdaq: -0.53%) and even gold. In regions directly affected by the conflict, fears of local stock market closures and banking disruptions catalyzed organic demand for a borderless, censorship-resistant liquid asset operating 24/7.
De-escalation and the Mechanical Short Squeeze
The spectacular bounce to $71,500 was precipitated by de-escalation signals from the White House, hinting at a possible ceasefire. The announcement of a coordinated release of 400 million barrels from strategic reserves triggered a 12% crash in oil prices, while the VIX volatility index fell 10% to 22.93.
Microstructure analysis reveals, however, that this bounce was not purely organic accumulation. The 3.29% single-day surge was powered by the forced liquidation of $186 million in short positions within 24 hours. A short squeeze-driven rally often lacks the substance needed to break through major macroeconomic resistance without subsequent real capital inflows.
🏦 Monetary Policy: The March 18 FOMC as the Pivotal Inflection Point
The FOMC meeting scheduled for March 18, 2026 stands as the quarter’s fundamental catalyst. Derivatives markets assign a probability exceeding 92% to a rate hold within the current 3.50%–3.75% range. No cut is fully priced in by the market.
Institutional attention is therefore focused exclusively on the « Dot Plot » — the FOMC members’ forward projections for the rate path. For an asset with no cash flows like Bitcoin, revisions to this chart generate asymmetric volatility. Historically, Bitcoin has registered declines following seven of the last eight FOMC meetings.
| Period | Fed Action | BTC Price Before | BTC Price (48h After) | Change |
|---|---|---|---|---|
| January 2025 | Hold | $102,400 | $97,800 | -4.5% |
| March 2025 | Hold | $86,200 | $82,100 | -4.8% |
| May 2025 | Hold | $94,600 | $91,300 | -3.5% |
| September 2025 | -25bp Cut | $118,400 | $112,600 | -4.9% |
| November 2025 | -25bp Cut | $122,800 | $119,100 | -3.0% |
| December 2025 | -25bp Cut | $96,300 | $98,100 | +1.9% |
| January 2026 | Hold | $90,400 | $83,383 | -7.3% |
Additionally, Jerome Powell’s mandate ends in May 2026, and the nomination of Kevin Warsh introduces a long-term macroeconomic volatility variable. A vocal critic of quantitative easing, Warsh could accelerate Fed balance sheet reduction (Quantitative Tightening) — a mechanical near-term headwind for speculative assets.
⚖️ Regulatory Paralysis: The CLARITY Act Impasse
In March 2026, the US is experiencing a legislative paralysis crisis around the Digital Asset Market Clarity Act. Passed by the House in July 2025 with overwhelming bipartisan support (294–134), the bill is recognized as the most comprehensive crypto legislation ever drafted for the American industry.
Its core aim: ending a decade of SEC-led « regulation by enforcement » that kept the industry in permanent legal ambiguity. The law would unambiguously classify Bitcoin as a digital commodity under CFTC jurisdiction, enshrine DeFi activity protections, and prohibit the Fed from issuing a retail CBDC.
However, it remains stalled in the Senate. Trump’s ultimatum demanding passage of the SAVE America Act first pushed CLARITY to the back of the legislative queue. Prediction markets now put the probability of passage at just 18% in 2026. This prolonged uncertainty has already catalyzed the exit of nearly $1 billion from the US crypto market toward more permissive jurisdictions.
🏛️ Institutional Integration: The Silent Adoption Continues
Paradoxically, legislative inertia contrasts sharply with the speed of private sector execution. Several landmark developments illustrate accelerating institutional adoption:
- Kraken Financial secured a limited-purpose master account at the Kansas City Fed, granting it direct access to central bank payment rails — a historic breach in the wall separating TradFi from crypto.
- Wells Fargo filed a « WFUSD » trademark with the USPTO, signaling its entry into the dollar-backed stablecoin space.
- Mastercard launched its Crypto Partner Program, federating 85+ crypto firms (Ripple, Solana, Circle, Binance, Paxos) to normalize blockchain-based cross-border settlements.
- MicroStrategy acquired an additional 17,994 BTC for $1.28 billion, bringing its total treasury to 738,731 BTC — more than 3.5% of the theoretical maximum supply of 21 million.
📊 Macro Technical Analysis: The Death Cross Looms
Analysis of higher timeframes reveals a major bearish charting event: the confirmation of a Death Cross on the 3-day chart. This signal — produced when the SMA 50 crosses below the SMA 200 — reflects a severe degradation where medium-term price dynamics capitulate to long-term inertia.
| Cycle | Decline Before Cross | Additional Loss Post-Cross |
|---|---|---|
| 2013/2014 | -72% | -52% |
| 2017/2018 | -67% | -50% |
| 2021/2022 | -58% | -46% |
| March 2026 | -47.4% | TBD |
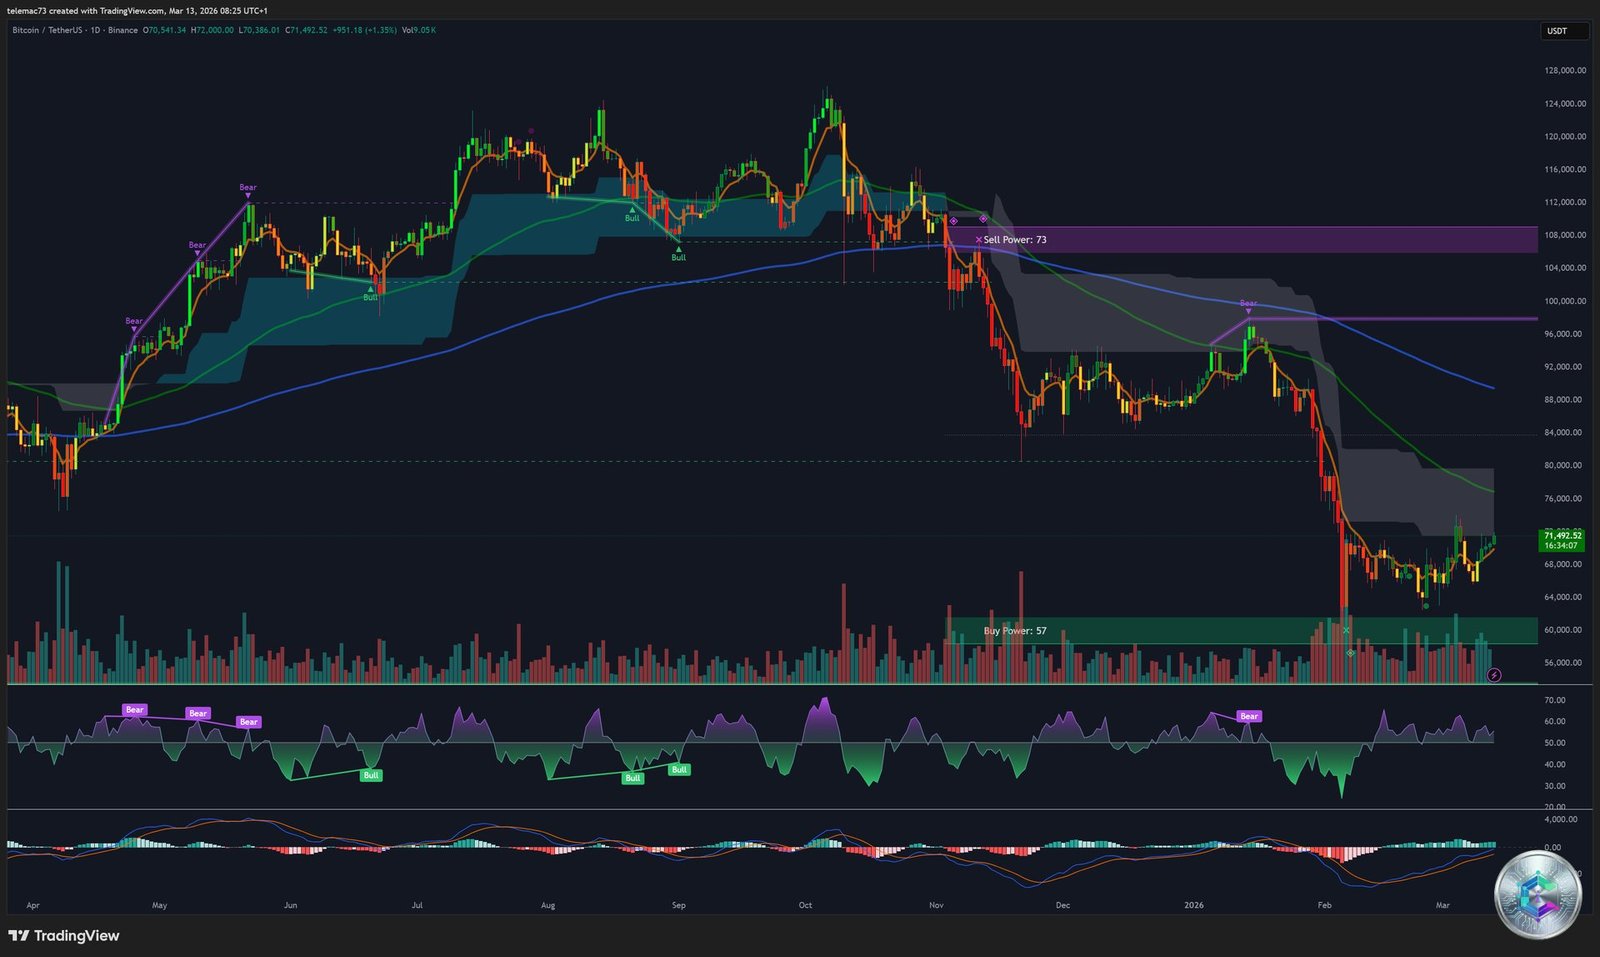
On the daily chart, price is evolving beneath a particularly thick Ichimoku Cloud (Kumo), representing massive structural resistance. The « True Market Mean » — estimated on-chain at approximately $79,000 — constitutes the main glass ceiling that must be reclaimed to validate a long-term bull market recovery. As long as Bitcoin consolidates below this threshold, it remains structurally in a macroeconomic bear channel.
On the positive side: the daily RSI at 60.25 leaves room for expansion before overbought territory (70+). The MACD is registering a positive signal (339.1), and all daily moving averages (MA 5 through MA 200) are generating algorithmic buy signals, with price trading above all of them.
📈 Meso Analysis (4H): Bear Flag vs. Symmetrical Triangle
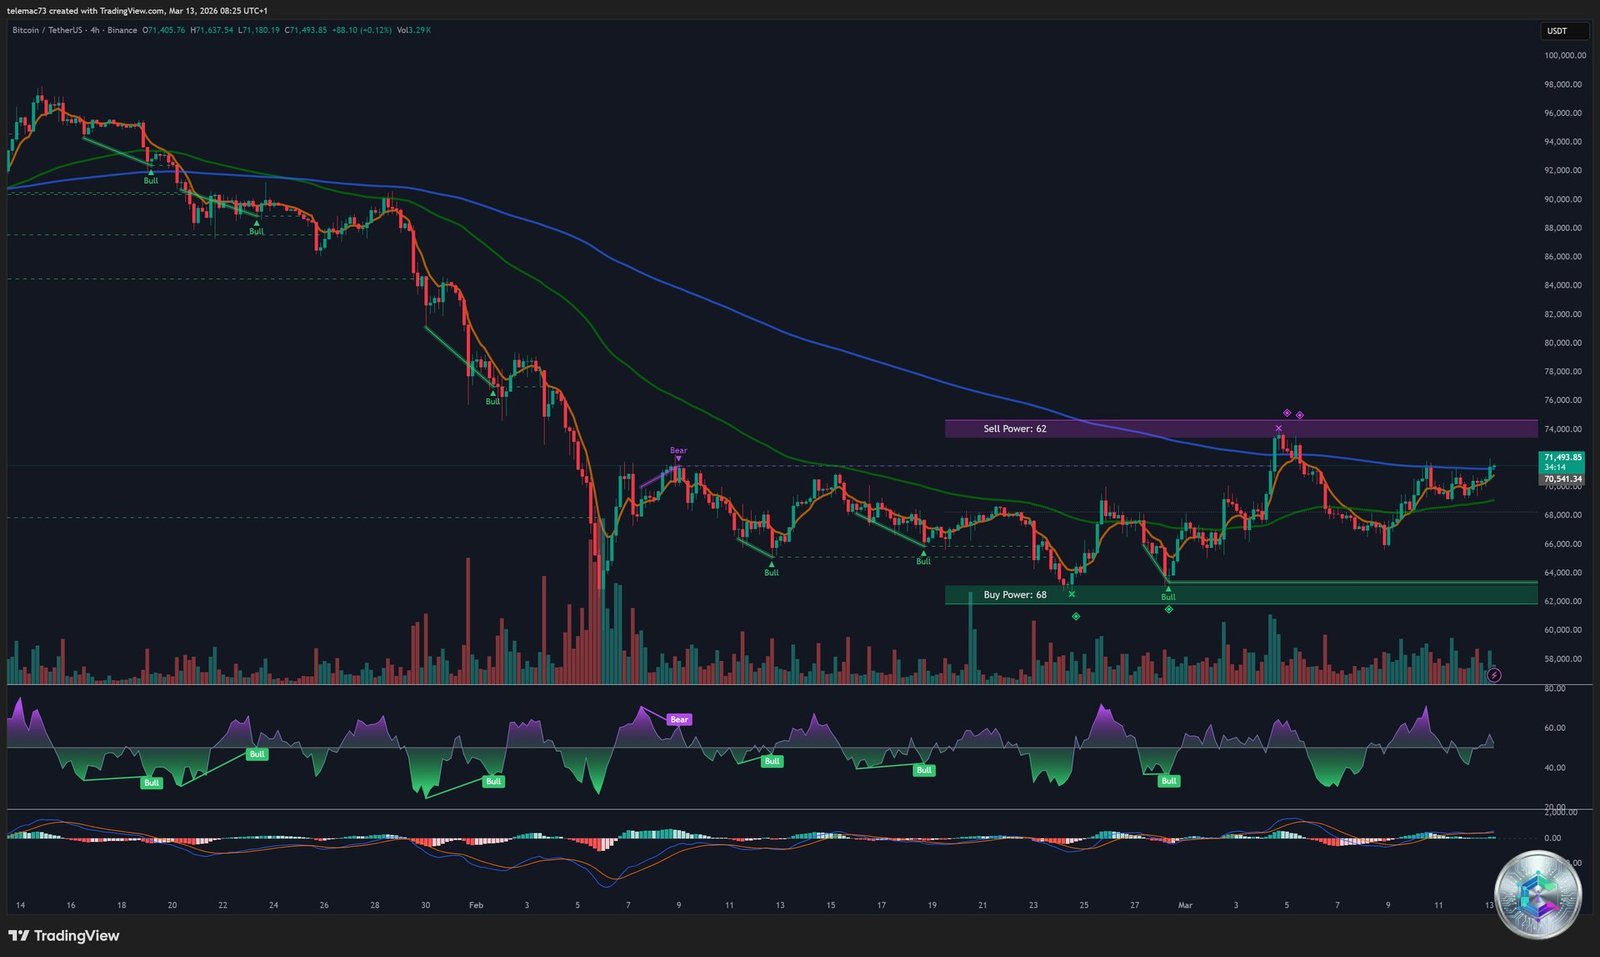
The 4-hour chart reveals a tectonic conflict between two major opposing chart patterns:
The Bear Flag Pattern
Looking back from late February, Bitcoin traced the flagpole of a bear flag during its initial drop. The subsequent slightly ascending consolidation forms the « flag. » If this classic structure resolves with a breakdown through the lower support:
- Critical floor support: $62,300
- Theoretical breakdown target: $41,400 (-39%)
- Intermediate Fibonacci stops: $56,800 and $52,300
The Symmetrical Compression Triangle
Immediate price action partially contradicts this bearish scenario. The recent volatility squeeze has carved a symmetrical indecision triangle. Immediate resistance sits at $71,520. A confirmed bullish breakout (close with significant volume expansion) would instantly invalidate the Bear Flag threat, with technical projections to:
- First target: $77,288
- Theoretical extension: $81,134
🔬 15-Minute Microstructure & Liquidity Heatmap Analysis
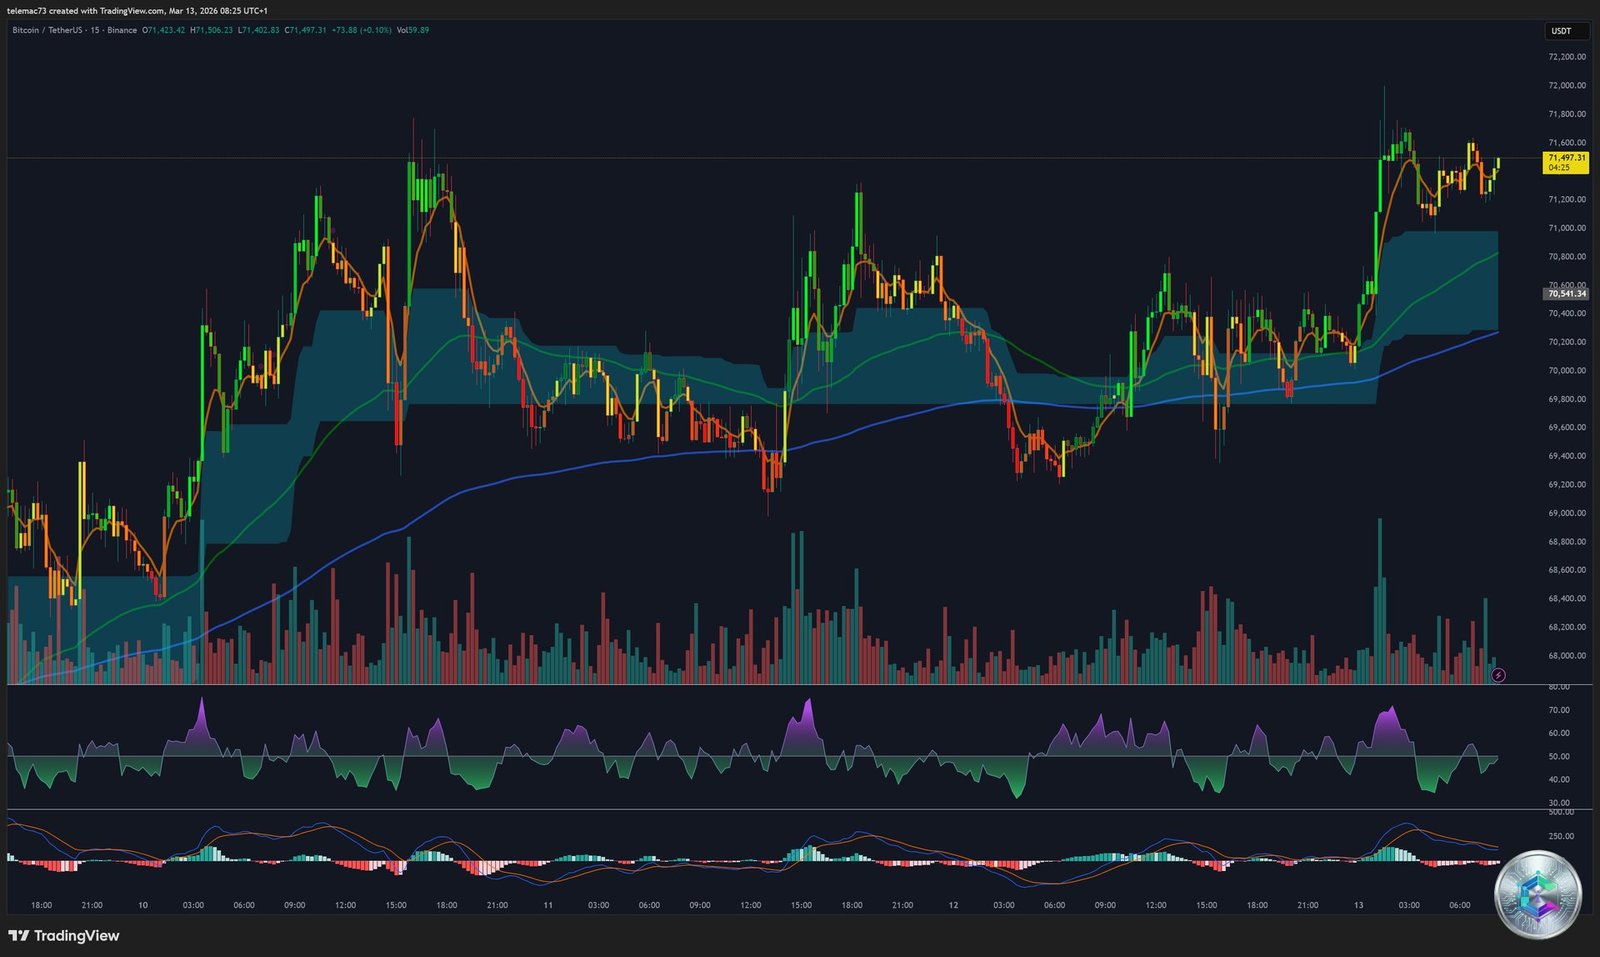
The 15-minute chart illustrates the organized chaos of high-frequency trading. Prices oscillate violently around $71,497, with erratic volume spikes reflecting heavy bot and arbitrage algo participation. The stochastic oscillator (Stoch 9,6) has spiked to a critical 98.78, while Williams %R reads -1.07 — both indicating an extreme overbought state that is nearly unsustainable at this timeframe.
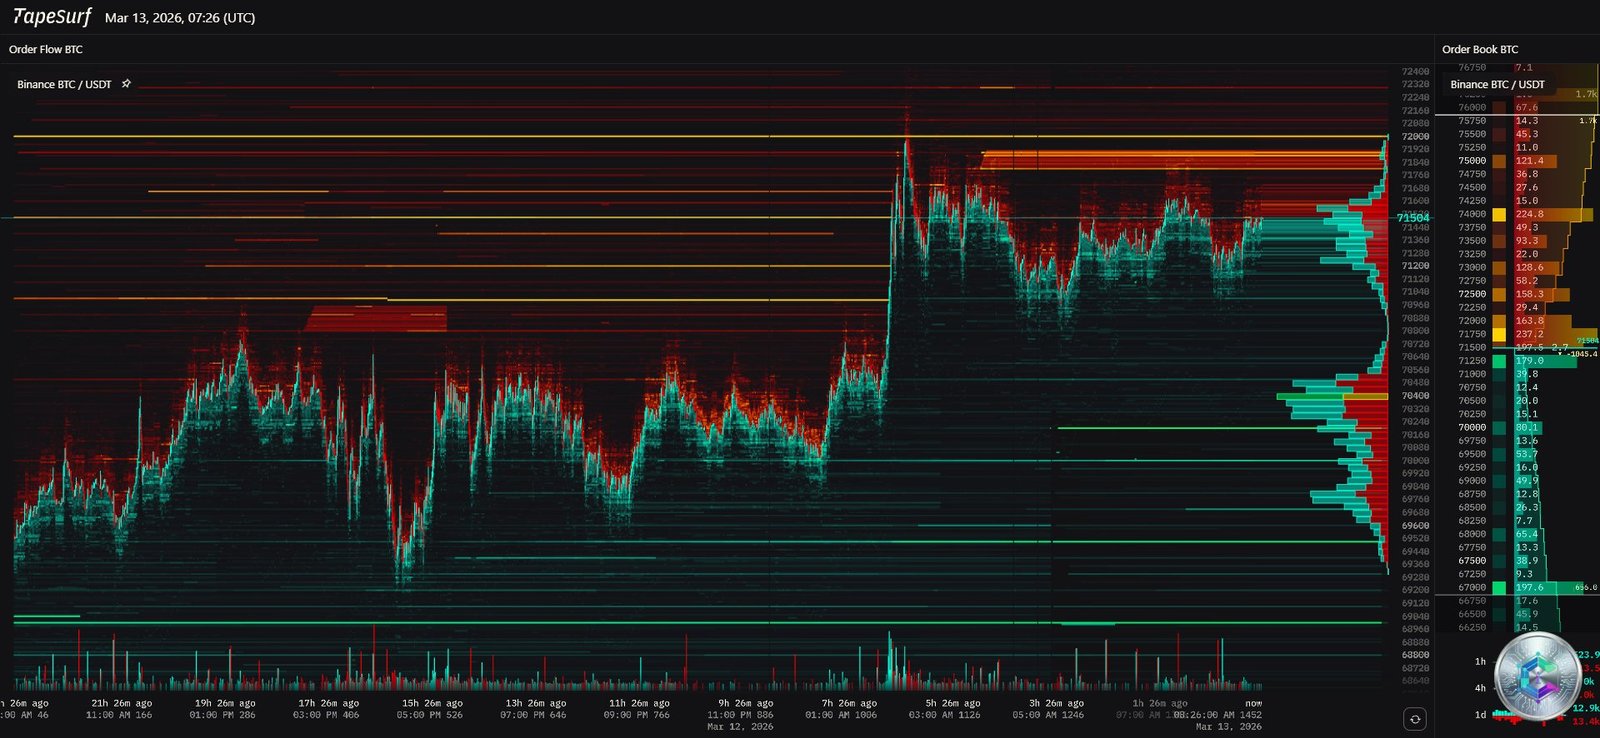
The liquidity heatmap (Order Flow) reveals a titanic liquidation wall built by highly leveraged short positions (50x–100x) in the precise zone of $71,800 to $72,000. This monumental asymmetry transforms this threshold into a gravitational magnet for price.
Modeling shows that a mere 10% upward move would liquidate an equivalent of $4.34 billion in short positions, versus only $2.35 billion for a similar downward move — confirming the path of least resistance is upward.
However, the heatmap holds a sobering warning. Above this wall, between $72,000 and $76,000, map density evaporates — a « liquidity vacuum ». Once the wall is consumed by the liquidation cascade, the mechanical fuel for further upside will be exhausted. If Bitcoin is catapulted toward $75,000 by squeeze momentum, sustaining the move beyond $76,000 will require real spot demand from institutional buyers. If that substitution fails, Bitcoin faces an invisible wall, loses momentum instantly, and becomes vulnerable to a violent rejection that could send it back below the $60,000 psychological support.
📉 Options Market: Institutional Bullish Asymmetry
On the Chicago Mercantile Exchange (CME), implied volatility has recently peaked at 75% for calls and 95% for puts — levels unseen since 2022 — signaling institutional anticipation of an imminent, violent directional breakout.
Fascinatingly, the Put/Call ratio for March 2026 expiry shows a decisively bullish skew of 3 to 1: $660 million in open interest on calls vs. only $240 million on puts. A significant cohort of institutional players is betting heavily on a positive resolution of macro and legislative catalysts before end of Q1.
🎯 Synthesis: Two Scenarios for End of March 2026
✅ Base Case: Asymmetric Rally (Short Squeeze Ignition)
The path of least resistance favors an upside expansion scenario, initially driven by mechanical rather than fundamental parameters. A breakout above $71,520 (4H triangle) would pull price into the gravitational orbit of the $71,800 liquidation wall, triggering a massive short squeeze cascade. Sustaining the trend would require synchronous macro catalysts:
- A dovish Dot Plot on March 18 (2 projected cuts instead of 1)
- A surprise CLARITY Act unlock in the Senate
- A weekly close above $79,000 (True Market Mean) to structurally invalidate the Death Cross
❌ Bear Case: Liquidity Trap and Final Capitulation
If the push toward $72,000 is not supported by sufficient organic volume, buyer exhaustion will validate the macro Bear Flag structure. In a « higher for longer » Fed context, the loss of the critical $62,300 support level would trigger an algorithmic sell cascade targeting:
- $56,800 (Fibonacci retracement)
- $52,300 (intermediate support)
- $41,400 (mathematical Bear Flag projection)
Key levels to watch: $71,520 (bullish trigger) — $71,800 (liquidation explosion zone) — $79,000 (True Market Mean, bull validation) — $62,300 (invalidation of bullish structure).
⚠️ Disclaimer: This article is written for educational and informational purposes only. It does not constitute investment advice, a recommendation to buy or sell digital assets, or financial advice of any kind. Cryptocurrency markets are highly volatile and past performance does not guarantee future results. Any investment decision should be made with full awareness of the risks involved, ideally with the guidance of a qualified financial advisor.