
The first quarter of 2026 stands as a pivotal moment for Bitcoin. The convergence of geopolitical shocks, major monetary policy shifts, and derivative market liquidation dynamics has forged a market structure of exceptional analytical density. Here is our complete dissection of the forces at play.
1. Macroeconomic Environment: The Strait of Hormuz Crisis
The start of March 2026 has been dominated by a dramatic escalation of geopolitical tensions in the Middle East. Military confrontations involving the United States, Israel, and Iran culminated in threats to close the Strait of Hormuz — the maritime chokepoint through which approximately 20% of global crude oil consumption passes.
The materialization of this risk immediately pushed Brent crude beyond $82 per barrel. For financial markets, this sudden surge in energy costs represents not a mere sectoral adjustment, but a systemic macroeconomic risk. Major investment banks warn that these disruptions could push US inflation back toward the 5% zone, instantly destroying the « soft landing » narrative and paralyzing central banks’ ability to ease credit conditions.
Initial Reaction: « Risk-Off » Mode and Flight to Safety
Facing this renewed uncertainty, capital massively fled equity markets (S&P 500, Nasdaq, Nikkei, Kospi). Gold briefly surpassed the psychological threshold of $5,000 per ounce. In this context, Bitcoin was initially treated as a high-beta tech asset, correlated with technology stocks, forcing a plunge toward the $60,000 – $63,000 zone.
However, the post-shock dynamic reveals a fundamental evolution: while pressure on equities persisted, Bitcoin launched a spectacular rebound of over 20% from its lows, re-entering the $71,000 – $73,000 zone within days. This decoupling illustrates the asset’s growing maturity as an alternative store of value against long-term fiat currency devaluation.
2. Monetary Policy: Kevin Warsh’s Nomination to the Fed
The most disruptive fundamental event lies in the official nomination of Kevin Warsh to chair the Federal Reserve, formally submitted to the Senate on March 4, 2026. This announcement acted as a powerful electroshock across all financial markets, and particularly on the crypto ecosystem.
Former Fed Governor (2006–2011), Warsh distinguished himself through strict monetary orthodoxy, vigorously opposing quantitative easing programs after the 2008 financial crisis. However, his nomination by the Trump administration — which actively advocates for aggressive rate cuts — suggests a pragmatic reversal. Warsh has advanced the hypothesis that massive productivity gains from artificial intelligence could create a structural disinflationary environment, providing the central bank room to lower credit costs without reigniting inflation.
For the crypto industry, the crucial element: Warsh has publicly described Bitcoin as an « important asset », perceiving it more as an alternative reserve asset — a « digital gold » — rather than mere speculative software technology. This intellectual openness at the apex of US monetary authority has been interpreted by the market as the potential genesis of a regulatory golden age.
Rate Trajectory: The FOMC’s Dilemma
Despite this optimism, economic data reality places the FOMC (meeting scheduled March 18, 2026) before a complex dilemma. Inflation remains « sticky » at 2.9%, well above the official 2% target. Prediction markets assign 98% probability to a rate hold in March, with a significant fraction of traders no longer expecting more than one, or even any, rate cut for all of 2026.
Legislative Progress: The Clarity Act
Congress is currently studying the « Clarity Act » (also referenced as the « Genius Act »), a bipartisan bill intended to definitively clarify the taxonomy of digital assets, categorically separating commodities (CFTC) from securities (SEC). Adoption of this legal framework would finally provide the regulatory clarity indispensable to enabling massive capital entry from pension funds, university endowments, and sovereign wealth managers.
3. Institutional Flows: The Bitcoin ETF Resurrection
Flows within US spot Bitcoin ETFs constitute the most reliable barometer for measuring institutional investor engagement. February-March 2026 has been the theater of a polarity inversion of unprecedented violence.
February’s Hemorrhage: $8.9 Billion Drawdown
Since late January 2026, Bitcoin ETFs endured five consecutive weeks of net capital outflows, with the worst single week seeing the destruction of nearly $1.49 billion. Integrating the underlying asset’s depreciation (BTC moving from $120,000 to $60,000), the total ETF drawdown in invested value reached the abyssal figure of $8.9 billion.
The average cost basis for US Spot ETF investors sits around $79,000. Consequently, the vast majority of capital deployed in these regulated vehicles found itself in a latent loss position when BTC dipped below $65,000, generating palpable anxiety about potential « break-even selling » paralysis.
March’s Resurrection: +$1.45 Billion in 5 Days
The break happened brutally and asymmetrically. On Monday, March 2, the 12 US-listed spot Bitcoin ETFs recorded combined net positive inflows of $458.2 million, alongside the remarkable statistic of zero outflows across the entire complex. The dynamic intensified, accumulating over $1 billion in three consecutive days, then reaching a staggering $1.45 billion over five consecutive days.
| Fund | Ticker | Flows March 2 | Flows March 3 |
|---|---|---|---|
| iShares Bitcoin Trust (BlackRock) | IBIT | +$263.2M | +$322.0M |
| Fidelity Wise Origin | FBTC | +$94.8M | -$89.3M |
| Bitwise Bitcoin ETF | BITB | +$36.4M | Positive |
| VanEck Bitcoin Trust | HODL | +$19.5M | Positive |
| Grayscale Bitcoin Trust | BTC | +$18.4M | Neutral |
| Franklin Bitcoin ETF | EZBC | +$14.0M | Minor positive |
BlackRock’s IBIT acts as a genuine gravitational black hole, absorbing over $585 million in fresh capital in just 48 hours. Total net assets under management for US spot Bitcoin ETFs surged to over $87.58 billion, with these funds now controlling between 6.4% and 7% of total Bitcoin supply in circulation.
4. Multi-Timeframe Technical Analysis
Daily Chart: The Purge and Compression
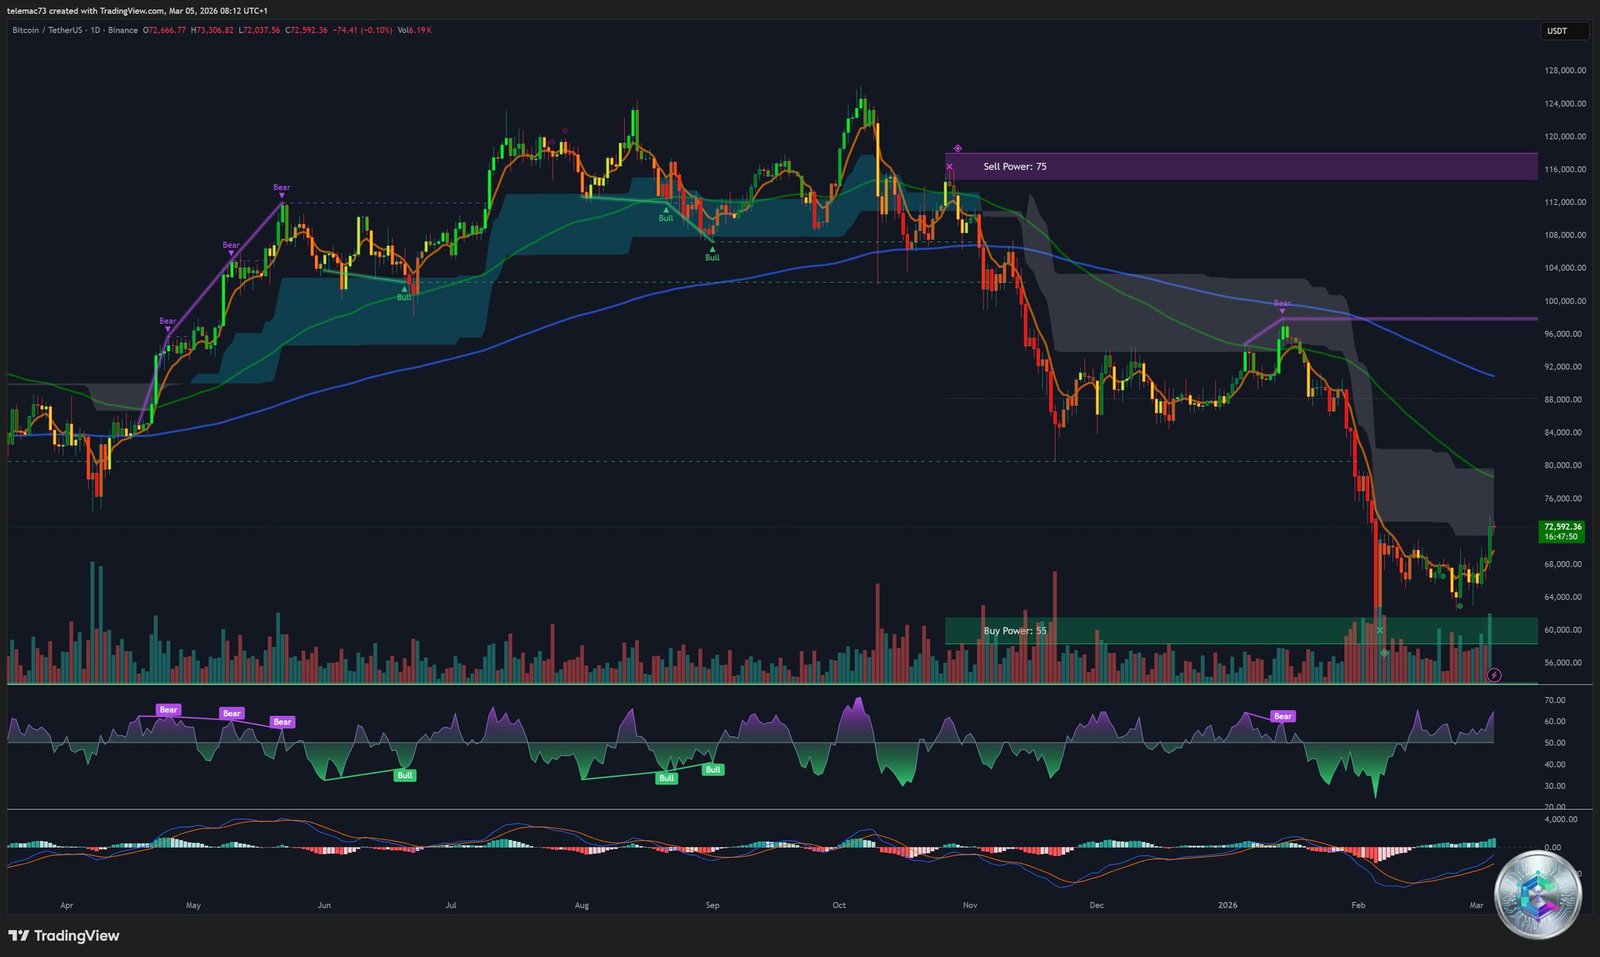
The daily chart highlights the violence of the deleveraging cycle endured since the $126,000 peak. The macroscopic downtrend is characterized by a continuous succession of lower highs and lower lows. However, the critical zone of $60,000 – $62,500 has functioned as a genuine structural shield.
RSI at 18 — Extreme Capitulation Signal: The daily RSI reached a value of 18, translating a state of systemic capitulation. Such a depth of oversold conditions has no historical equivalent except during the COVID-19 flash crash (March 2020) and the post-FTX collapse (2022-2023). The « V »-shaped inflection of the RSI exiting oversold territory marks a higher low, an early warning signal of waning seller power.
Symmetrical Triangle of Compression: The bullish invalidation of a « Bear Pennant » in favor of a Symmetrical Triangle is crucial. The triangle’s base at $63,000 and its upper boundary at $72,000 define the indecision zone. In classical chart theory, a validated upside breakout projects a measured objective targeting precisely $80,000.
4-Hour Chart: The MACD Golden Cross
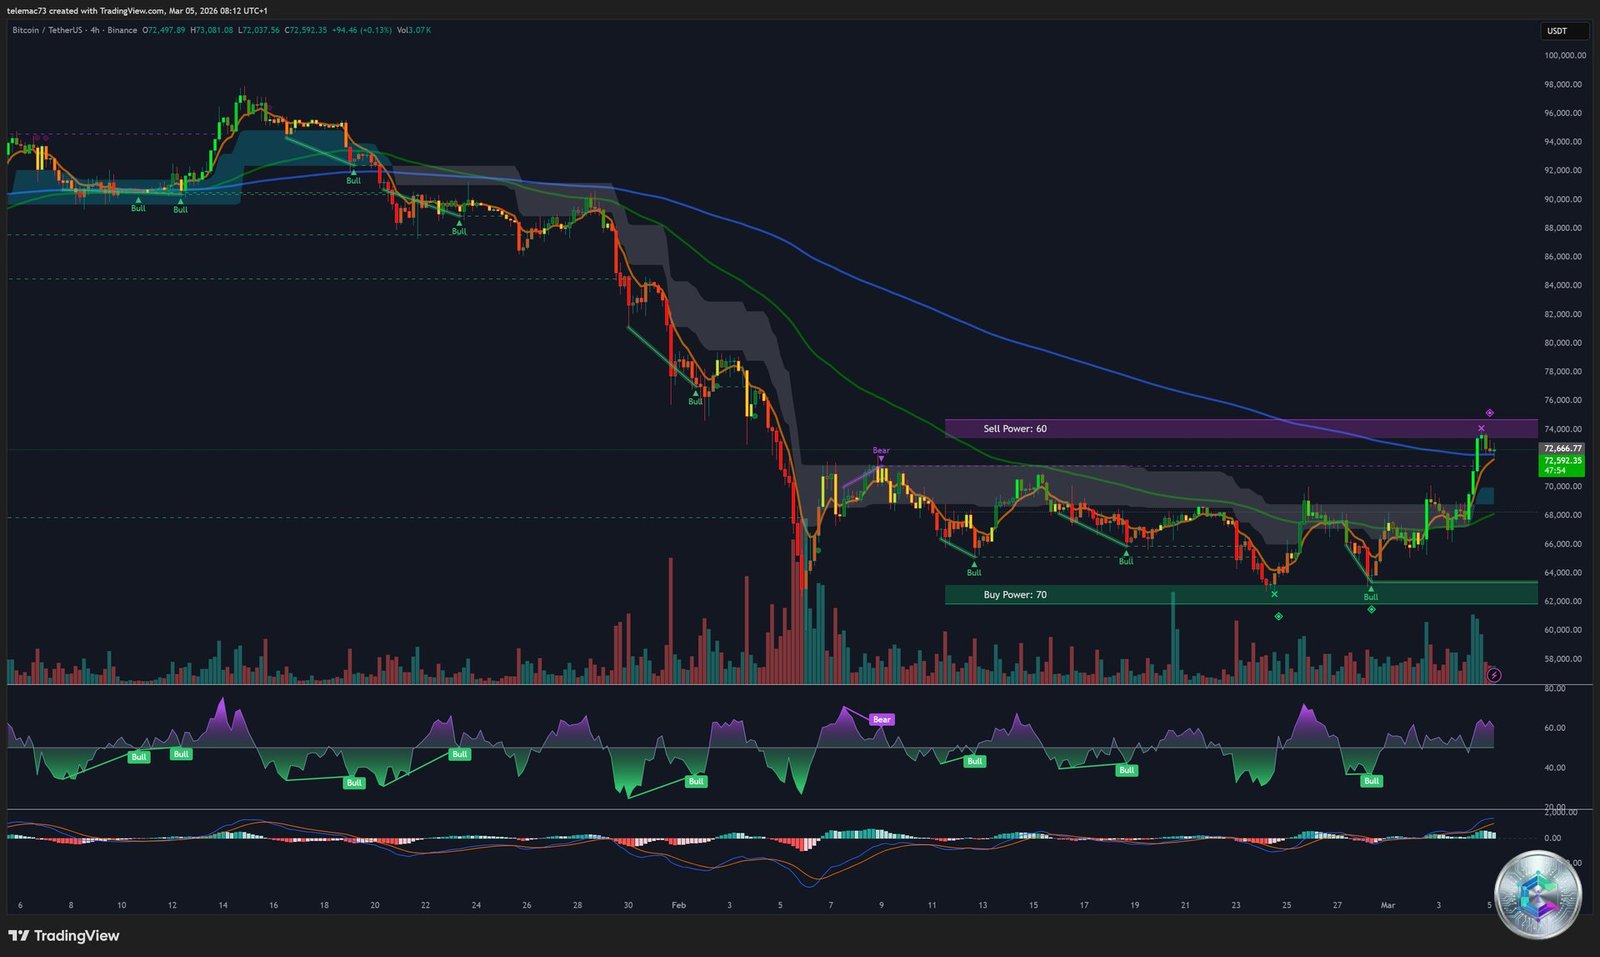
The most salient technical element on the H4 horizon is the MACD Golden Cross: the fast line has decisively pierced the slow signal line from below, triggering robust and growing green histogram bars. This signal indicates a sudden surge in buying momentum, typical of a short squeeze.
After bouncing from the « Buy Power: 70 » zone (~$62,000), price has violently pierced the H4 EMA 50/100 to become embedded in the dynamic resistance zone around $74,000, where the H4 EMA 200 (~$71,000 – $72,000) also operates. The current battle consists of transforming this resistance into support through technical polarity.
15-Minute Chart: Algorithmic Micro-Structure
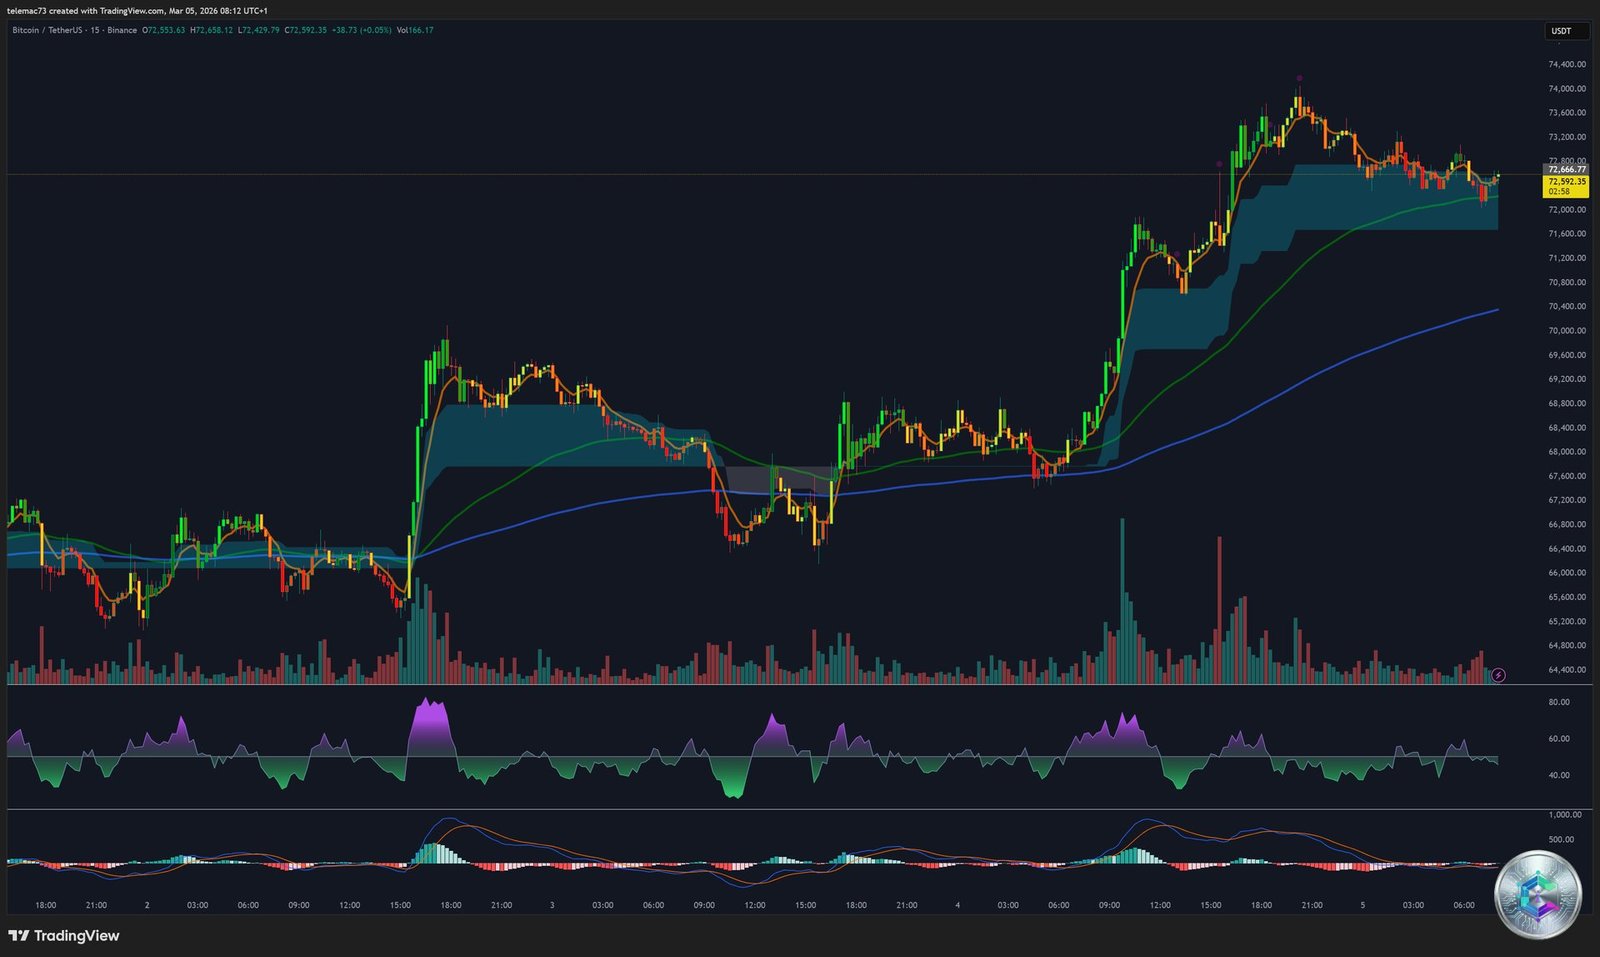
The intraday scale exposes the behavior of trading algorithms and the surgical injection of liquidity. The chart illustrates a stair-step ascent from the $64,000 floor toward the $73,000 local highs. Institutional execution algorithms are visible: progressive buying without causing excessive slippage, with volume concentrated explosively at the beginning of the bullish movement.
The M15 MACD shows signs of early exhaustion, oscillating around the zero line. The MFI (Money Flow Index) stagnates at neutrality (~48.5), prompting Grid Trading algorithms to exploit micro-variations without strong directional commitment in the very short term.
5. Order Flow, Heatmap & Liquidity Pools
Psychological Walls
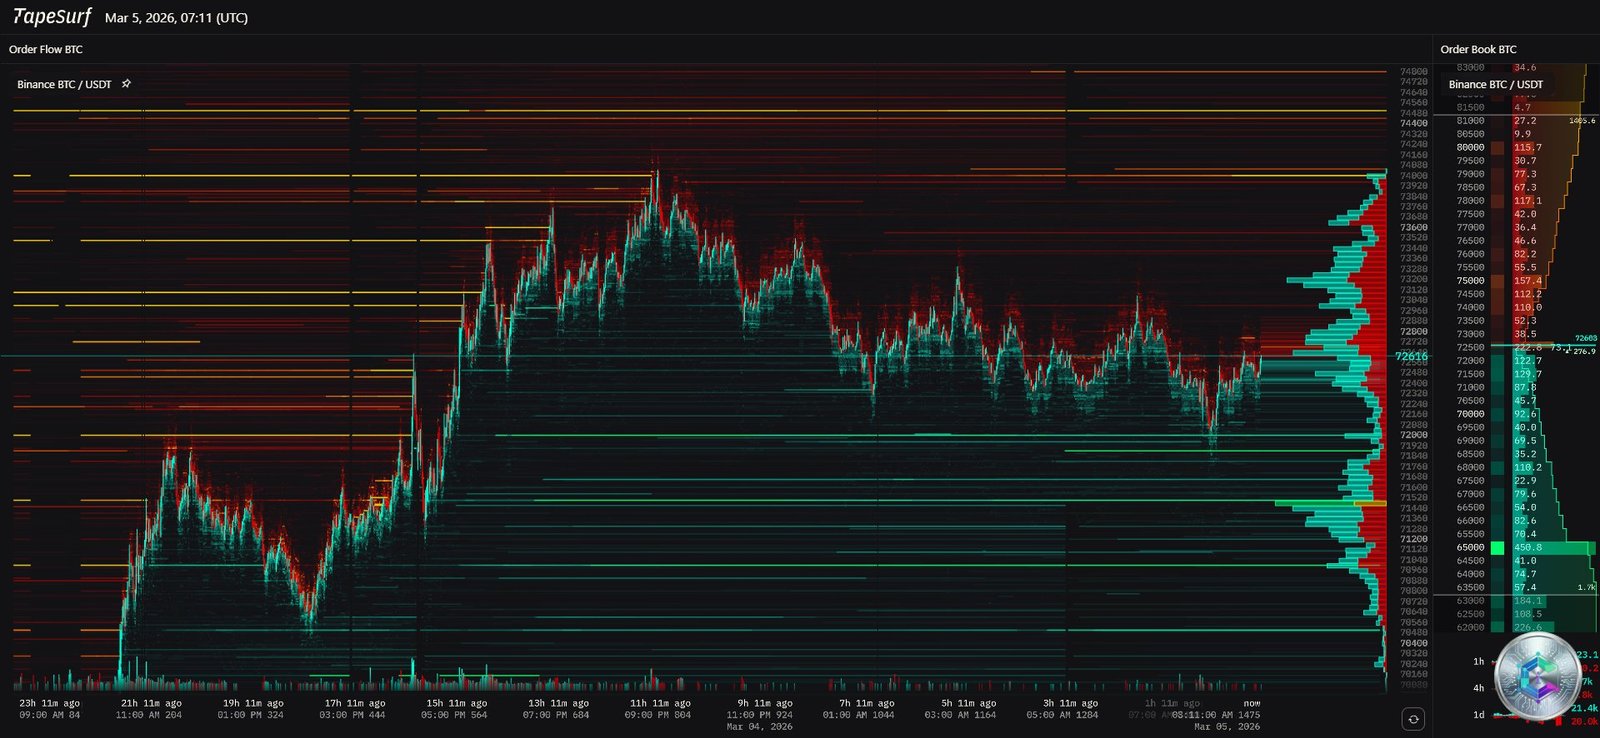
The Sell Wall (Resistance): A massive concentration of limit orders obstructs the zone immediately above $73,000, thickening considerably toward $75,000 and $80,000. These colored strata (yellow → orange → bright red) represent institutional take-profit and short-selling orders. The Volume Profile confirms massive peaks between $72,000 and $74,000, transforming this area into a technical fortress difficult to penetrate without exceptional market buy orders.
The Buy Wall (Support): The lower portion displays dense buy limit orders deeply anchored in the $60,000 – $62,500 range. These institutional buy limits constitute the structural safety net that allowed Bitcoin’s elastic rebound when it touched these levels in February.
Liquidation Architecture: The Market’s Fuel
Total Open Interest approaches historical peaks, surpassing $3.15 billion. The Liquidation Heatmap reveals an explosive dichotomy:
- Short Squeeze Fuel (upside target): A cataclysmic risk pocket concentrates approximately $4.3 billion of heavily leveraged short positions between $70,000 and $72,000. If buying pressure from ETFs or institutional actors maintains price firmly above $72,000, these positions will be mechanically liquidated, generating an uncontrollable cascade of algorithmic buying propelling BTC toward $80,000.
- Bearish Cascade Risk (downside target): An extremely dense agglomeration of extreme-leverage long positions (50x–100x) has accumulated between $63,000 and $66,000. Breaking the pivot support at $66,296 would trigger the chain liquidation of a pool of $1.22 billion, precipitating BTC toward $50,000.
CME Gaps and Options Gamma Magnet
Two CME gaps structure algorithmic trajectories: a gaping upper gap between $79,660 and $81,210 (primary magnet for buyers), and a lower gap at $65,880 (potential liquidity purge before any bull run). The $75,000 strike identified as the primary Gamma Magnet will mathematically force market makers to buy BTC if price approaches it, creating intrinsic upward traction.
6. Key Level Mapping for March 2026
| Level (USD) | Type | Justification |
|---|---|---|
| $90,000 | Secular Resistance | 200-day EMA — required to validate full macro trend reversal |
| $79,660 – $81,210 | Magnetic Target | CME Gap fill + Symmetrical Triangle measured objective |
| $74,000 – $75,000 | Major Technical Resistance | Daily EMA 50 + Sell Wall + Options Gamma Magnet |
| $70,000 – $72,000 | Pivot « Kill Zone » | H4 EMA 200 + $4.3B in shorts awaiting liquidation |
| $67,450 – $68,100 | Short-Term Dynamic Support | Murray 3/8 line + SMA 21 + MA 30 — immediate directional bias |
| $65,000 – $65,880 | Intermediate Support / CME Gap | Lower CME Gap fill — liquidity purge target |
| $63,000 – $64,000 | Danger Line | Descending channel median + start of long liquidation cascade |
| $60,000 – $62,500 | Macro Floor « The Floor » | Validated institutional Buy Wall — break = $50,000 target |
7. End-of-Quarter Scenarios
🟢 Bullish Scenario: The Short Squeeze Explosion
This scenario rests on the positive feedback loop initiated by ETF flows and leverage dynamics. Required catalysts: relative Middle East de-escalation preventing a lasting CPI surge, favorable Senate confirmation of Warsh with positive Clarity Act signals, continued ETF inflows.
Technical trigger: A confirmed daily close above $72,000 – $72,800 with increasing volume. This breakout will initiate the chain liquidation of $4.3 billion in shorts, propelling price toward EMA 50 ($74,400), then toward the Gamma Magnet ($75,000), and finally toward the inevitable pull of the CME gap at $80,000 — mathematically validating the Symmetrical Triangle target.
🔴 Bearish Scenario: Macro Pressure and Liquidation Cascade
The inflationary persistence of the Hormuz conflict forces the March 18 FOMC to adopt a severely restrictive hawkish tone with no promise of rate cuts for 2026. The $74,000 resistance proves impenetrable. The market registers a lower high and initiates a downward rotation. Systemic danger zone: breach of $63,000 – $66,000, triggering the chain liquidation of the $1.22 billion long pool, erasure of the $60,000 « Floor, » and acceleration toward the terminal support of $50,000.
Strategic Conclusion
The holistic analysis of Bitcoin in March 2026 highlights the hybrid and mature nature of this asset. Far from the simplistic narrative of an isolated technology value, Bitcoin now behaves as an ultra-sensitive liquidity sensor, reacting equally to geopolitical shockwaves in the Strait of Hormuz and to the subtleties of Federal Reserve nominations.
The conjunction of opposing forces creates paroxysmal tension. The return of institutional flows (+$1.45 billion in 5 days via ETFs), the invalidation of the Bear Pennant, and the RSI recovering from its abyss sketch a technical landscape in healing phase. But barriers remain: ETF cost basis at $79,000, the shadow of the 200-day EMA at $90,000, and the explosive Open Interest architecture.
Bitcoin’s directionality in the coming weeks will not be dictated by chance, but by the implacable confrontation between the magnetic pull of the $80,000 CME gap and the gravitational pressure of an uncertain interest rate environment under the next Fed era. The outcome of this compression period will determine whether Bitcoin confirms its digital gold status or relapses into the limbo of speculative assets with high macroeconomic leverage correlation.
⚠️ Disclaimer: This article is written for educational and informational purposes only. It does not constitute investment advice, a recommendation to buy or sell digital assets, or financial or legal advice. Cryptocurrency markets are highly volatile and present high risks of capital loss. Only invest what you can afford to lose and consult a qualified financial advisor before making any investment decision.