
The global financial ecosystem, and the digital asset market in particular, is navigating a period of historic turbulence and structural redefinition in early March 2026. The complex interplay between exceptional geopolitical tensions in the Middle East, unprecedented institutional capital flight, and major regulatory shifts in the United States has triggered a systemic shockwave across risk assets — with Bitcoin (BTC) squarely at the epicenter.
As of March 4, 2026, Bitcoin is trading in an erratic volatility range, oscillating between $66,967 and $68,116, registering significant losses amid a broad risk-off environment. This institutional-grade analytical report dissects with surgical precision the fundamental, on-chain, and purely technical components of this valuation.
🌍 The Geopolitical Shock and the Energy Crisis
Bitcoin’s current price dynamics cannot be accurately modeled without a deep, multidimensional understanding of the underlying macroeconomic environment. The dramatic military escalation involving the United States, Israel, and Iran has led to a major geopolitical crisis centered on the Strait of Hormuz. Iran’s Islamic Revolutionary Guard Corps (IRGC) has formally claimed full control of this strategic maritime corridor, through which approximately 20% of the world’s energy supply flows.
This effective logistical obstruction triggered a rare and violent energy shock, propelling crude oil prices up nearly 13% in just five days. The implications for risk assets are direct and deeply damaging: a sudden, sustained spike in energy prices instantly reignites global inflationary pressures, forcing the Federal Reserve (Fed) to maintain its restrictive monetary stance. The DXY dollar index climbed 0.89% and gold tested new all-time highs beyond $5,247 per ounce.
In this climate of systemic risk-off, Bitcoin behaved in a purely pro-cyclical manner — its high-beta correlation with speculative assets overriding its theoretical safe-haven characteristics. The Fear & Greed Index plunged to an alarming level of 10, signaling absolute terror and irrational liquidation among market participants.
🏦 ETF Hemorrhage and the Institutional Dynamic
Bitcoin’s fundamental market structure was irreversibly transformed by the launch of Spot ETFs in early 2024. This financialization brought deep institutional liquidity, but simultaneously introduced heightened sensitivity to traditional macroeconomic cycles. On-chain analysis currently reveals a striking dichotomy between the brutal capitulation of recently-entered institutional investors and the continued methodical accumulation by long-term strategic entities.
Bitcoin ETFs are currently experiencing their most severe net outflow and drawdown phase since inception. A massive, sustained correction has wiped out more than $8.9 billion in invested value from local historical highs. BlackRock’s iShares Bitcoin Trust (IBIT) illustrates this institutional deleveraging in spectacular fashion: it has seen more than 42,000 BTC evaporate from its holdings, falling from a peak of over 806,000 BTC to significantly lower levels in an extremely short timeframe.
The psychological key to this selling pressure lies in cost-basis analysis: the average realized price for ETF holders is estimated at approximately $79,000. With the asset persistently trading below $69,000, an overwhelming proportion of these institutional investors find themselves deeply underwater. This creates a massive overhead supply zone — any technical bounce approaching $79,000 will inevitably face wall-of-supply selling from fund managers desperate to exit at break-even.
Despite this challenging backdrop, signs of capitulation exhaustion are beginning to emerge. BTC inflows to centralized exchanges have dropped sharply from nearly 90,000 BTC/day at the peak of panic to approximately 19,000 BTC/day — a classic signal of « weak hand » exhaustion. Meanwhile, the strategic acquisition of 30,000 BTC by Tian Ruixiang Holdings (TIRX) demonstrates that the Bitcoin-as-reserve-asset thesis continues to attract deep institutional capital with multi-year horizons.
⚖️ The Regulatory Battle Over Stablecoins
Any analysis of crypto market liquidity would be fundamentally incomplete without a thorough assessment of the stablecoin infrastructure. In early March 2026, a fierce legislative and regulatory battle threatens to dismantle and restructure these critical financial instruments.
The regulatory architecture is currently hanging on the intertwined fates of two landmark texts: the GENIUS Act, ratified last year to govern stablecoin issuance, and the CLARITY Act (Digital Asset Market Clarity Act), currently the subject of fierce negotiations in the U.S. Senate. The central point of contention is a proposal from the Office of the Comptroller of the Currency (OCC) that would formally prohibit stablecoin issuers from paying yields or returns to token holders.
This aggressive proposal is backed by the traditional banking lobby, exemplified by JPMorgan CEO Jamie Dimon‘s demands that yield-bearing stablecoin issuers be subjected to full banking regulation. If enacted, this could drain DeFi liquidity toward traditional finance, exponentially increasing transactional friction and exacerbating BTC’s structural volatility.
📊 Multi-Timeframe Technical Analysis
Daily Chart — The Bearish Macro-Structure
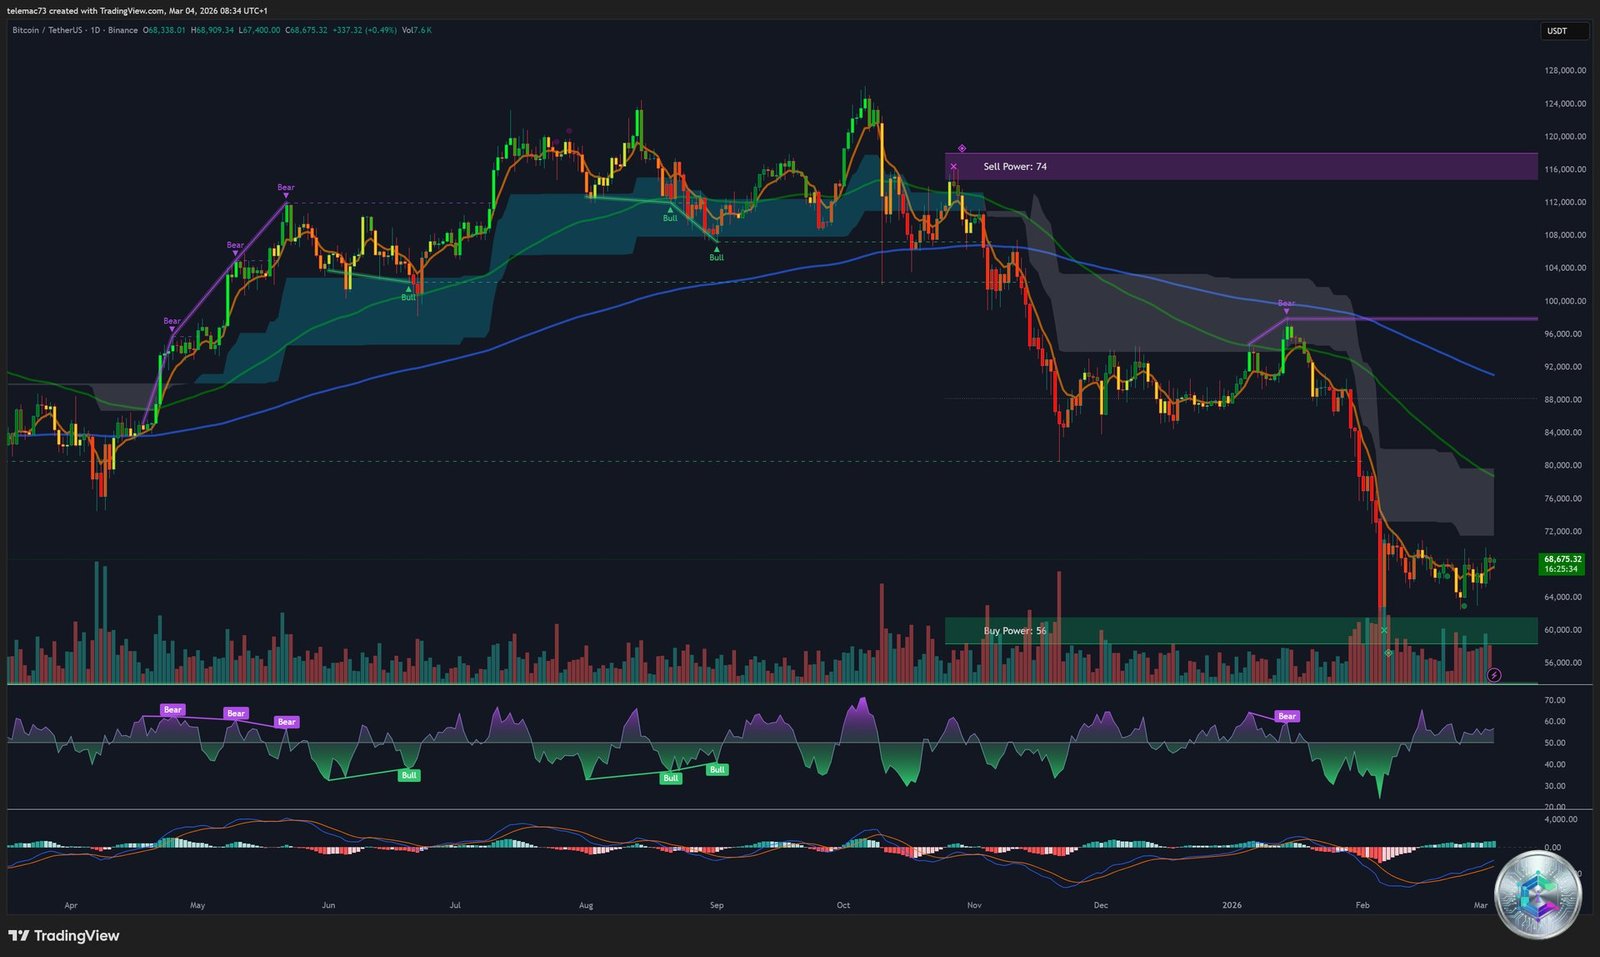
The daily chart reveals the classic anatomy of a speculative bubble burst followed by a prolonged capitulation phase. Price action shows a vertiginous freefall from euphoric highs around $124,000, collapsing through multiple support layers to wash out in the current battle zone of $60,000 – $68,000. The overall chart configuration forms a massive distribution structure characterized by consistently lower highs and lower lows — the textbook definition of a relentless bear market.
The 200-day Moving Average (MA200), the secular trend’s ultimate arbiter, is navigating around $66,451 – $66,548, desperately attempting to provide a psychological support floor. A clean daily close below this line would formally invalidate the bull market regime, mathematically opening the path toward the $50,000 abyss.
The daily RSI languishes in neutral territory around 43-54, confirming the total absence of organic bullish demand. The MACD shows early signs of a nascent bullish histogram crossover (value at 806.60), while the signal line remains deeply submerged in negative territory (-4,949.15) — a signal that absolutely requires price action confirmation to avoid becoming a devastating false breakout.
4-Hour Chart — Compression and Bear Flags
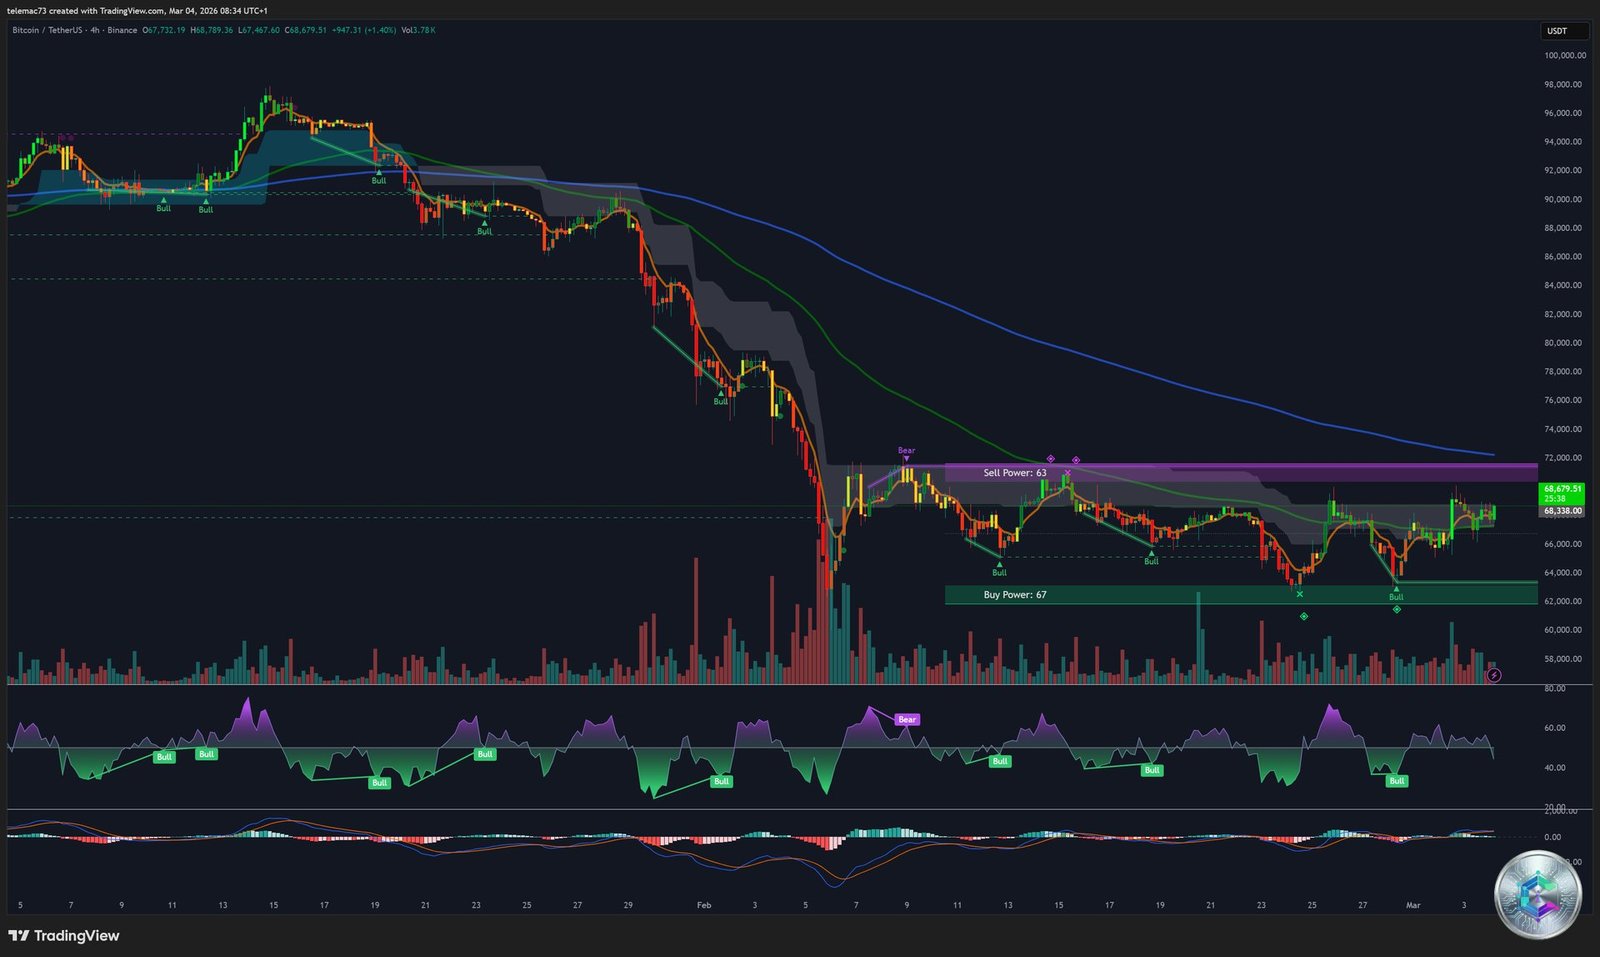
The 4-hour timeframe illustrates price action trapped in a broad consolidation zone following the collapse from the $90,000 region. « Bear » signals consistently dominate the rare appearances of « Bull » signals. Buying power registers a score of 67 against a selling power of 63 — a slight theoretical imbalance in favor of buyers that nonetheless fails to break through structural overhead resistance.
On the chartist level, this timeframe reveals the dangerous formation of bear flags. Following the high-volume pole formed by the initial freefall, the consolidation in the shape of a pennant or timid ascending channel constitutes historically a bearish continuation pattern. Without a massive volume climax to break the upper oblique resistance, statistical probability dictates a downside resolution, projecting a new leg down proportional to the initial decline.
15-Minute Chart — The Intraday Microstructure
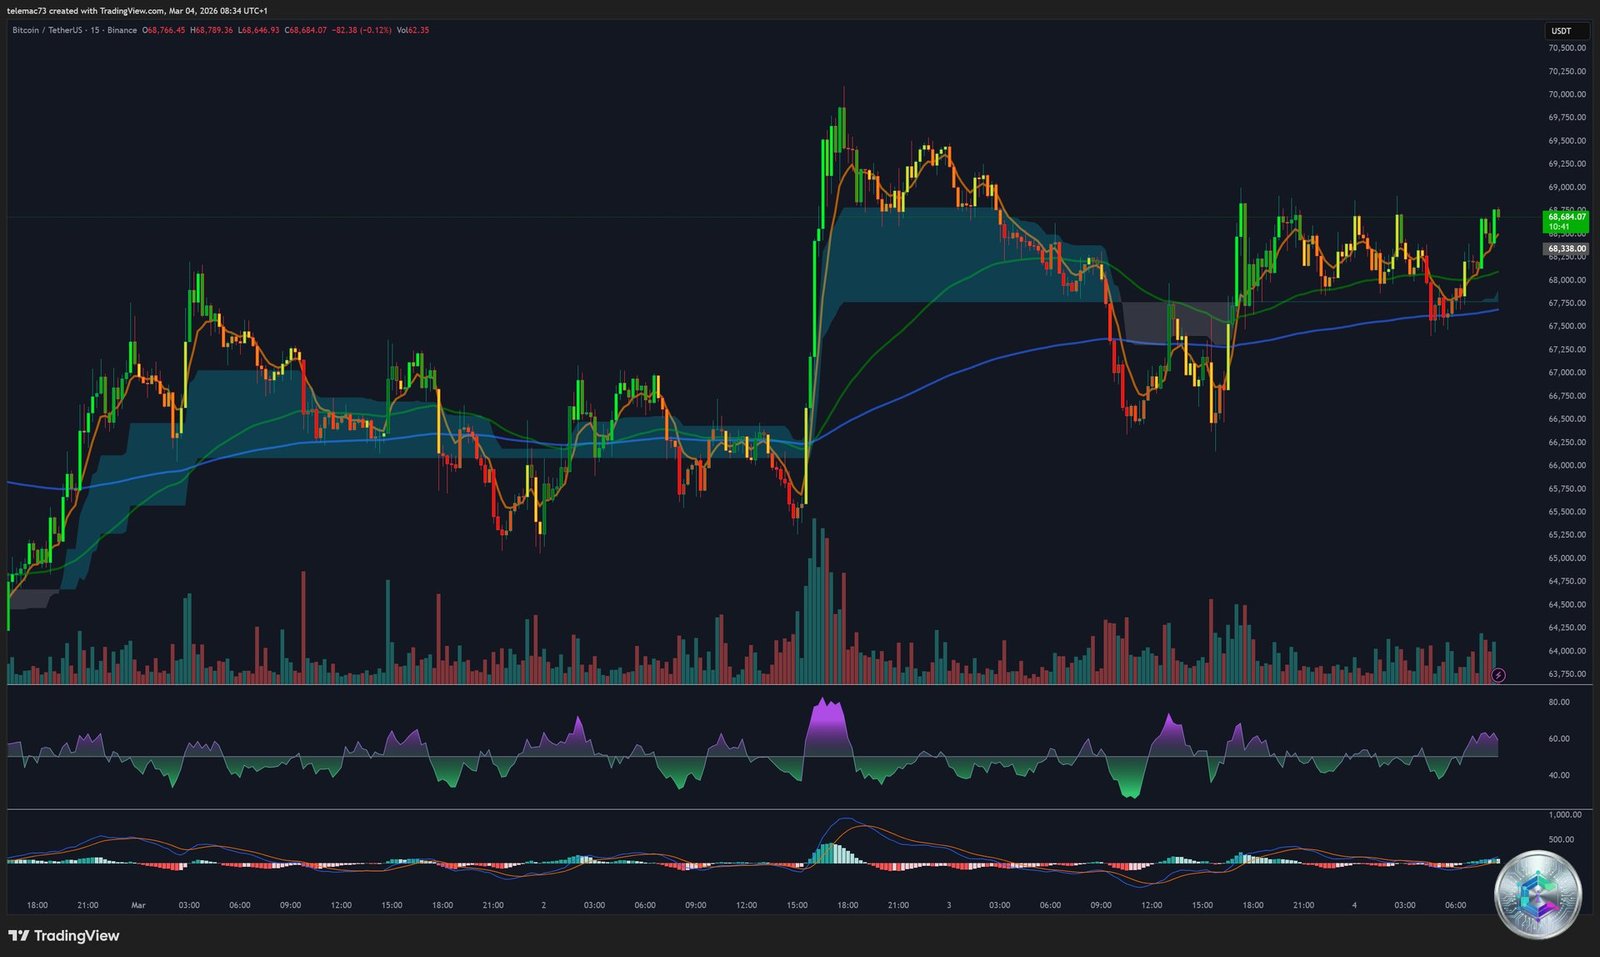
The 15-minute microstructure unveils extreme nervousness and instant reactivity to real-time information flows. A spectacular intraday bounce propelled price from the depths of $65,000 to the $69,000 region (a +5% swing), triggered by the surprise release of the U.S. ISM Manufacturing PMI, which crossed back above the pivotal 50 threshold, signaling unexpected economic expansion and briefly reigniting risk appetite among high-frequency trading algorithms.
The anatomy of this impulsive candle is revealing: a stop run and short squeeze orchestrated by market makers. The RSI instantly pierced into extreme overbought territory (above 80) before rapidly correcting as momentum faded. A death cross is now forming on the 15-minute MACD — confirming that the short-term buying energy has fully dissipated, with price declining in a staircase pattern back toward its gravitational center defined by higher timeframe structure.
TapeSurf Heatmap — Liquidity Cartography
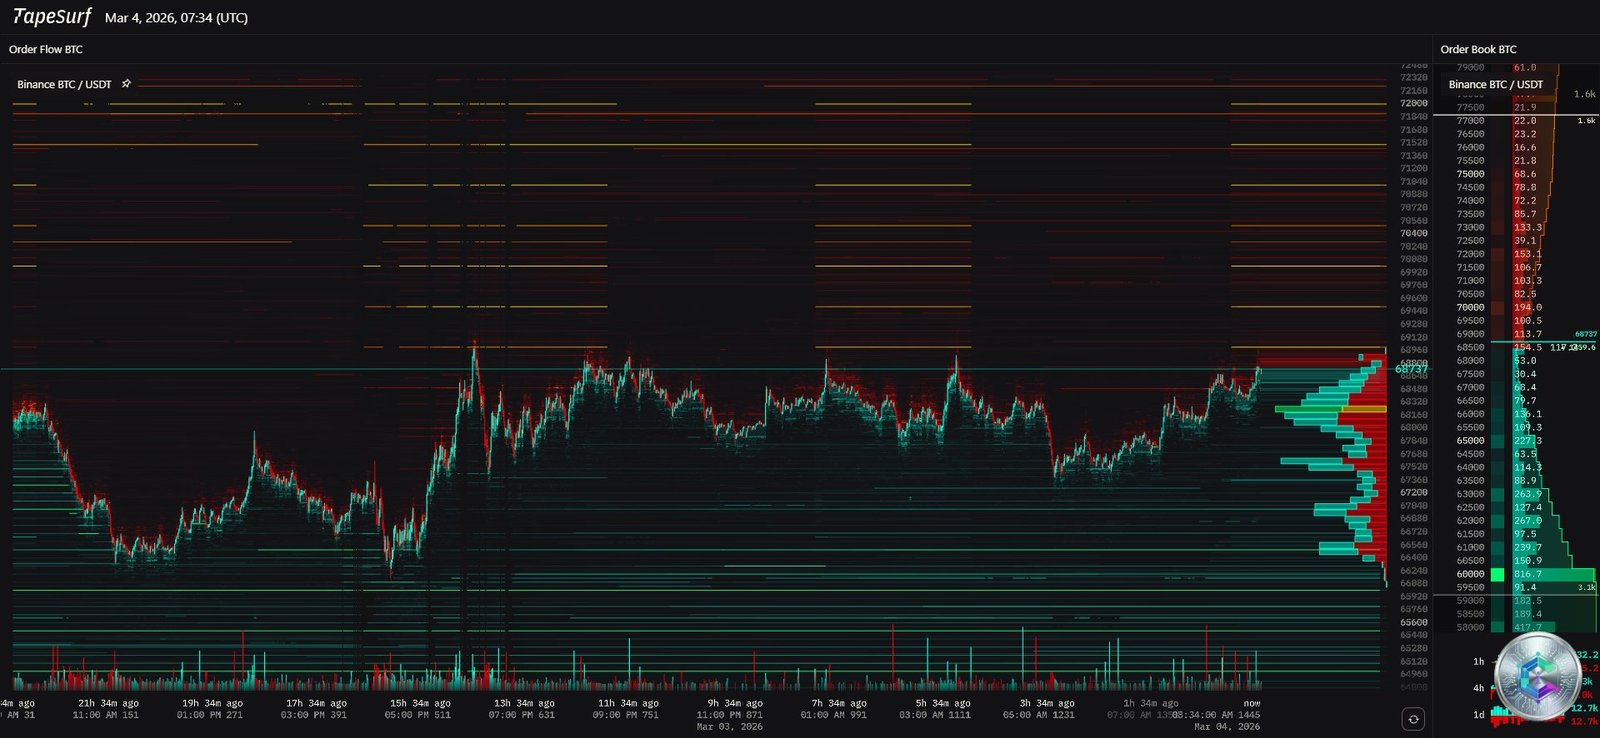
The TapeSurf heatmap reveals two vast liquidity pockets acting as critical barriers. Above current price, thick horizontal red lines mark a massive concentration of limit sell orders stacked between $70,000 and $72,000 — an institutional fortress virtually impregnable without a massive influx of exogenous capital. This confirms macroeconomic observations: investors are desperately seeking to distribute their holdings at these levels.
Below current price, luminous green layers signal limit buy walls protecting against a total collapse. These buyer liquidity pools are located primarily around $65,000, then much more heavily between $62,000 and $60,000. The overall Volume Profile confirms these lower zones as major gravitational attractors via the Point of Control (POC).
A critical anomaly demands attention: Open Interest on derivatives is rapidly expanding even as price declines — a classic bearish divergence signaling aggressive short positioning. This creates a powder keg: a geopolitical ceasefire could trigger a devastating short squeeze blasting through $70,000+, while a breakdown below $62,000 would cascade into forced long liquidations sending price into freefall.
📐 Strategic Pivot Points and Moving Average Framework
The pivot point matrix calculated using Classic, Fibonacci, Camarilla, and Woodie methodologies as of March 4, 2026 reveals an extremely tight central attraction cluster gravitating around $68,247 – $68,258. With Bitcoin currently trading slightly below this fundamental pivot, the intraday directional bias mechanically tilts toward the sell side. A sustained close — confirmed by expanding volume — above this $68,250 line is the non-negotiable technical prerequisite for any hope of reclaiming the first resistance crown (R1) at $68,417 – $68,517.
On the daily moving average front, the configuration reveals a suffocating compression: the fast MAs (MA5, MA10 around $68,161–$68,313) act as a descending iron ceiling progressively lowering onto prices, smothering any attempt at a bullish recovery. The macroeconomic foundations remain intact, however, with the MA200 at $66,451 serving as the last psychological bulwark before the bull market invalidation scenario.
🔮 Synthesis and Forward-Looking Scenarios
The market is currently operating in a choke point: trapped between the resilience of a historical floor at $60,000 and the oppression of an institutional ceiling at $70,000. The next volatility expansion will be explosive.
Bullish Scenario 🟢
The invalidation of the current bearish scenario rests exclusively on an exogenous macroeconomic paradigm shift: a rapid diplomatic resolution of the Middle East crisis leading to an oil price collapse and the triumphant return of the Fed dovish pivot narrative. This catalyst, and this catalyst alone, carries the required inertia to obliterate the sell walls stacked at $70,000 and initiate the massive short squeeze necessary to purge the market’s bearish asymmetry — with targets at $79,000 and beyond.
Bearish Scenario 🔴
A continuation of the geopolitical status quo, coupled with ecosystem asphyxiation by banking regulators attacking stablecoin profitability under the GENIUS Act, will precipitate the breakdown of the critical $62,000 support. Such an event would trigger cascading institutional margin calls, formally validating Bitcoin’s entry into a prolonged and severe crypto winter — with the first rational equilibrium level found only around $50,000.
⚠️ Disclaimer: This article is written for educational and informational purposes only. It does not constitute investment advice or a recommendation to buy or sell any asset. Cryptocurrency markets are extremely volatile. Do not make any financial decisions based solely on this article. Consult a licensed financial advisor before making any investment.