
On March 1, 2026, Bitcoin (BTC) trades in a critical compression zone at $66,990, with a market capitalization exceeding $1.3 trillion and a sector dominance of 56.30% over a global crypto market valued at $2.38 trillion. Beneath the surface of apparent resilience lies a striking dichotomy: on one side, a nearly 50% drawdown from the all-time high above $126,000 reached in October 2025; on the other, signals of massive institutional accumulation suggesting an unprecedented fundamental discount. The Fear & Greed Index has collapsed to 14 — « Extreme Fear » territory — yet it is precisely in these moments that the most asymmetric opportunities tend to emerge.
1. Macroeconomic Context: A Perfect Storm of Exogenous Shocks
1.1. Military Escalation in the Middle East
March 1, 2026 will be remembered for a sudden deterioration of the international security landscape. U.S. and Israeli forces launched direct strikes against targets in Iran, triggering an immediate shockwave across global financial markets. The reaction was brutal: $128 billion in crypto market capitalization was wiped out within a single hour, forcing Bitcoin toward alarming intraday lows before a stabilization attempt emerged.
This behavior illustrates a well-documented phenomenon: during systemic liquidity crises, Bitcoin initially behaves as a high-beta asset, sold first by risk-parity algorithms to cover margin calls. It is only once the liquidity crunch stabilizes that its store-of-value properties tend to reassert themselves.
1.2. Tariffs and the Inflation Specter
Simultaneously, the Trump administration’s announcement of new 15% global tariffs drove an additional 5% decline in BTC, pulling it toward the $64,800–$65,000 range. The paradox is twofold: in the short term, tariffs fuel inflation fears and keep pressure on risk assets; over the medium term, trade wars erode sovereign debt sustainability — theoretically fertile ground for Bitcoin adoption as a hedge against sovereign credit risk.
1.3. The Fed and the Mid-March FOMC Meeting
The primary arbiter of these diverging forces remains the Federal Reserve. The March 17–18, 2026 FOMC meeting crystallizes all expectations. Core inflation has fallen to 1.7% over the last three months, yet the Fed’s consensus remains fractured. Markets are pricing approximately 52% odds of a first rate cut in March. According to analysts like Arthur Hayes, when monetary expansion expectations reach their peak, Bitcoin could decouple from equities and target $124,000, or even $200,000.
1.4. The U.S. Strategic Bitcoin Reserve: An Unprecedented Psychological Floor
Unlike the bear markets of 2018 or 2022, Bitcoin now benefits from a structural safety net: its integration into the U.S. strategic balance sheet via an executive order in March 2025. This unprecedented institutional recognition radically alters the asset’s long-term risk profile, establishing a robust psychological floor that limits the severity of global drawdowns.
2. Institutional Dynamics: The ETF Flow Mechanics
2.1. Five Weeks of Outflows… Then the Reversal
U.S. Spot Bitcoin ETFs endured five consecutive weeks of net outflows from late January, purging approximately $3.8 billion from the ecosystem. The worst week saw nearly $1.49 billion evaporate. Yet these $4.5 billion in outflows represent only a fraction of the $107 billion that has flowed into these funds since their creation. The funds maintain $85 billion in AUM, representing over 6.3% of total Bitcoin supply in circulation.
The real story lies in the institutional holders’ resilience (stickiness): nearly 90% of capital remained invested despite the price being cut in half. This behavior signals a paradigm shift — institutions are no longer speculating short-term; they are allocating strategically.
2.2. The Late-February Inflection Point
The reversal began on February 24 with $257.7 million in net inflows, confirmed on February 25 with a massive $506.5 million — the largest single-day collection in three weeks. Within 48 hours, over $750 million in fresh capital was injected into the market. BlackRock (IBIT) led the charge at $297.4 million, followed by Grayscale (GBTC) at $102.5 million, Bitwise (BITB) at $39.4 million, and Fidelity (FBTC) at $30.1 million. The complete absence of net outflows across all 11 active ETFs during that session underscores a capitulation of selling pressure.
2.3. The Fracture Between Price and Fundamental Value
A logarithmic regression model covering 26 monthly observations (January 2024 – February 2026) isolated an elasticity coefficient of 0.27 between cumulative ETF flows and the BTC price:
Δln(BTC_Price) = 0.27 × Δln(ETF_Flows)This model exposes a spectacular market anomaly: the flow-implied fair value of Bitcoin should sit around $95,000. At the current price of $66,990, the asset trades at a structural discount of 41% versus its underlying real demand. Such divergences historically resolve through violent, rapid mean-reversion rallies.
3. On-Chain Analysis: The Psychology of Holders
3.1. A Massive Supply Overhang
The Q1 2026 on-chain diagnosis is unequivocal: market structure remains deeply fragile. No fewer than 9.2 million BTC are currently held at a loss. The 90-day Realized P/L Ratio has dipped below the critical threshold of 1.0, confirming an excess-loss regime that structurally impairs liquidity and weighs on every recovery attempt with suffocating distribution pressure.
Current capitulators belong to the 3–6 month holder cohort — investors who acquired Bitcoin during the euphoria surrounding the October 2025 peaks. The Accumulation Trend Score sits below 0.5, signaling a lack of whale conviction to aggressively absorb this supply.
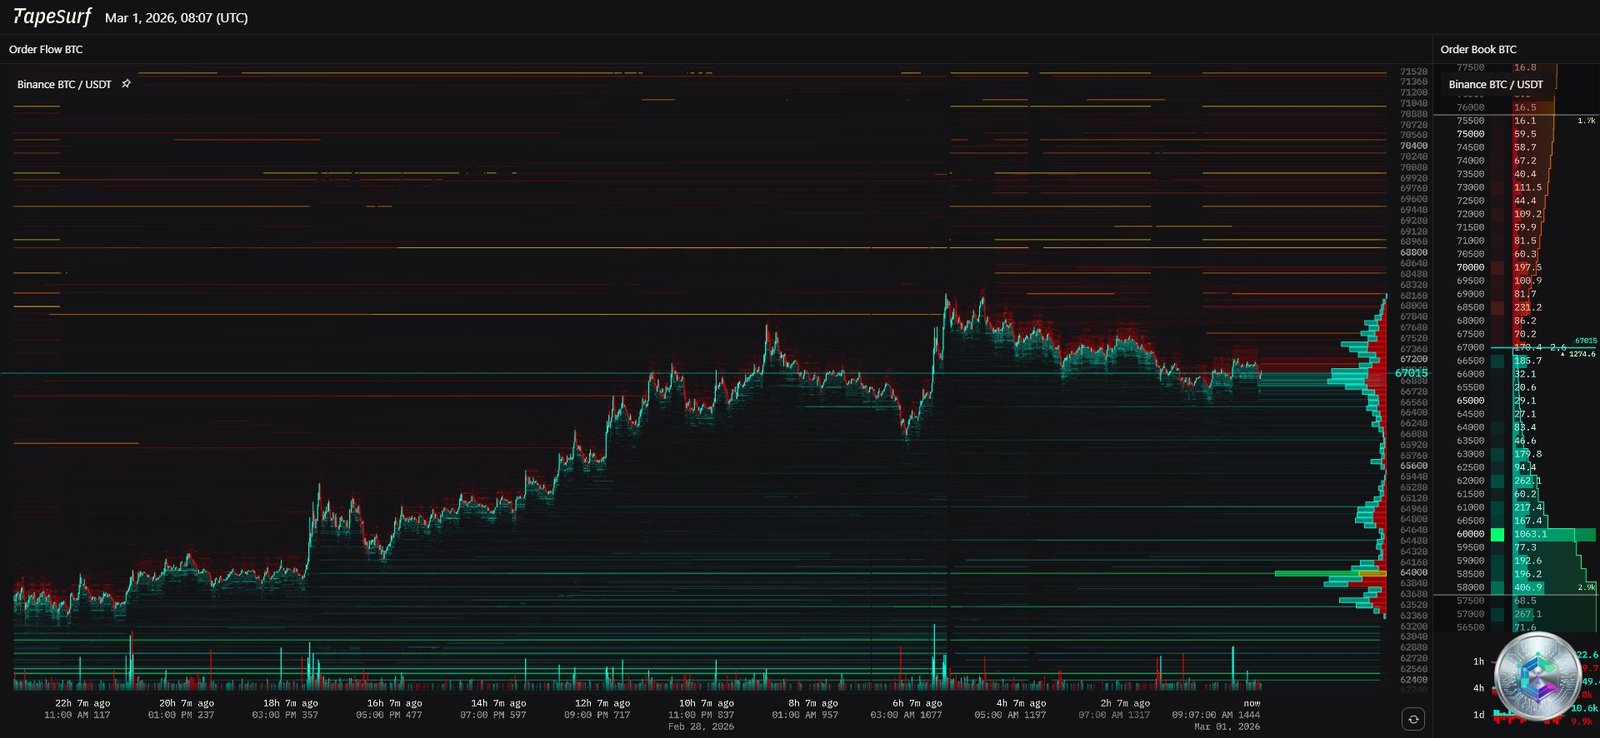
3.2. The Options Market and the Gamma Effect
The derivatives market has matured: open interest in Bitcoin options has definitively surpassed that of perpetuals. The options book reveals a growing concentration in put buying (protection), reflecting extraordinarily cautious risk appetite. The modeled Gamma Exposure mechanically forces market makers to sell rallies and buy dips, trapping Bitcoin in a straitjacket between $66,000 and $68,000. Only a massive directional spot liquidity inflow will break this dynamic.
4. Multi-Timeframe Technical Analysis
4.1. 15-Minute Chart: The Footprint of Exogenous Shocks
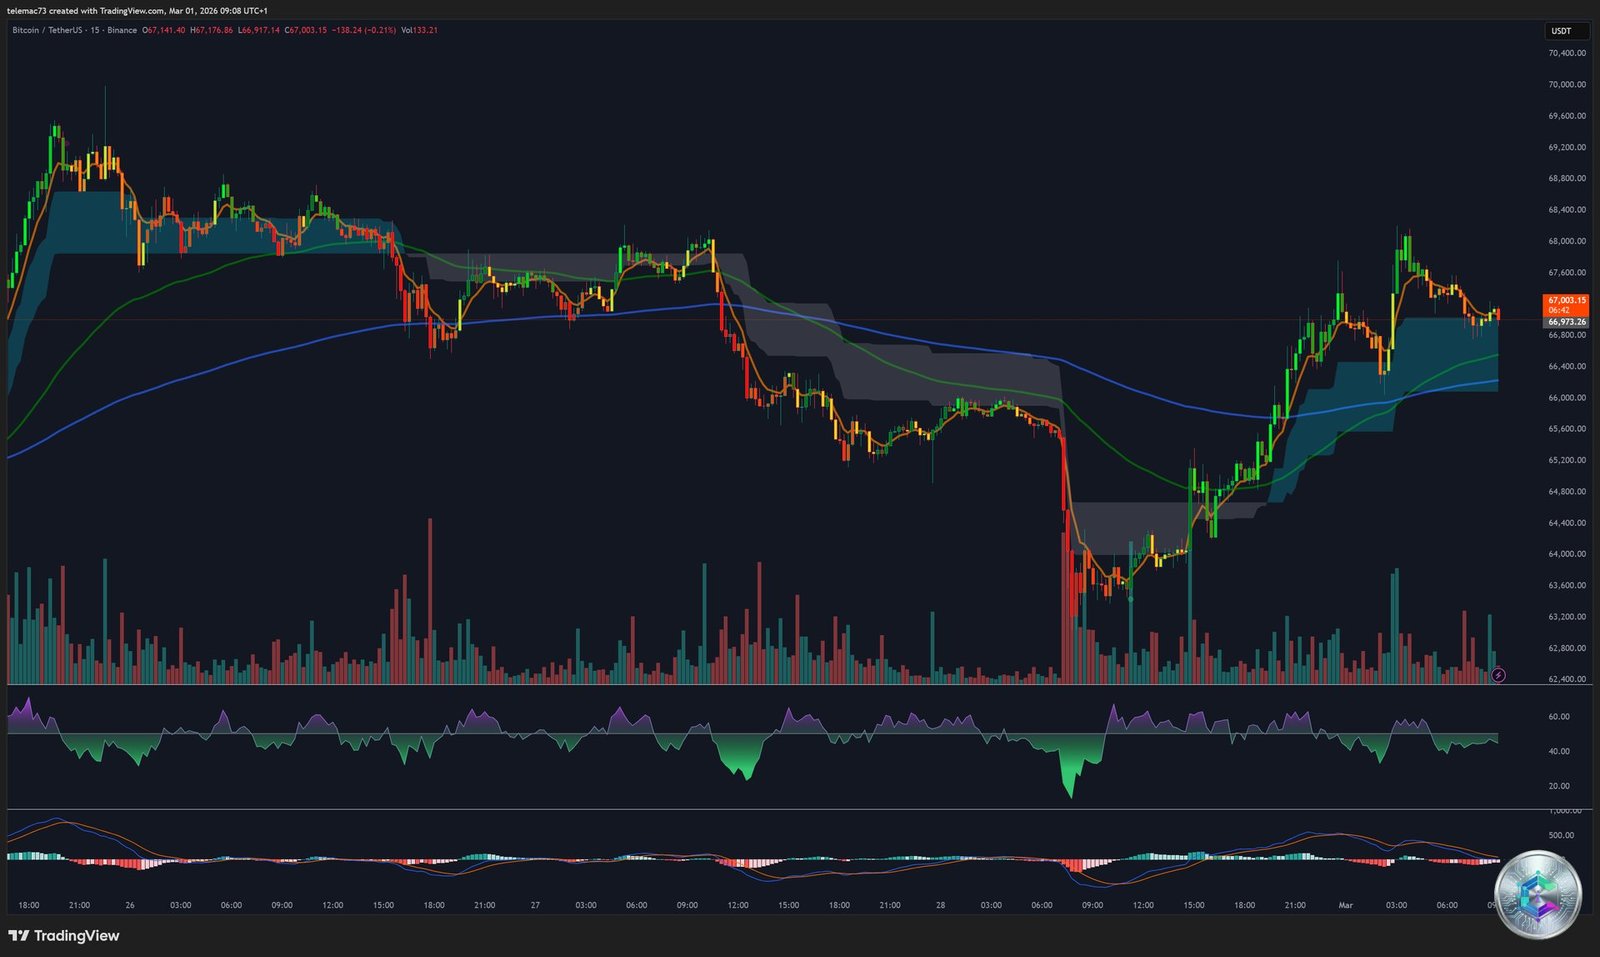
The 15-minute chart visually captures the recent exogenous shocks: the vertiginous drop triggered by the Middle East strikes followed by erratic consolidation. Candles with long upper and lower wicks illustrate the fierce battle between algorithmic buyers and panic sellers. The ATR (Average True Range) stands at $4,716 — an exceptionally high intraday range demanding absolute discipline in position sizing and stop placement.
4.2. 4-Hour Chart: The Battle of Moving Averages
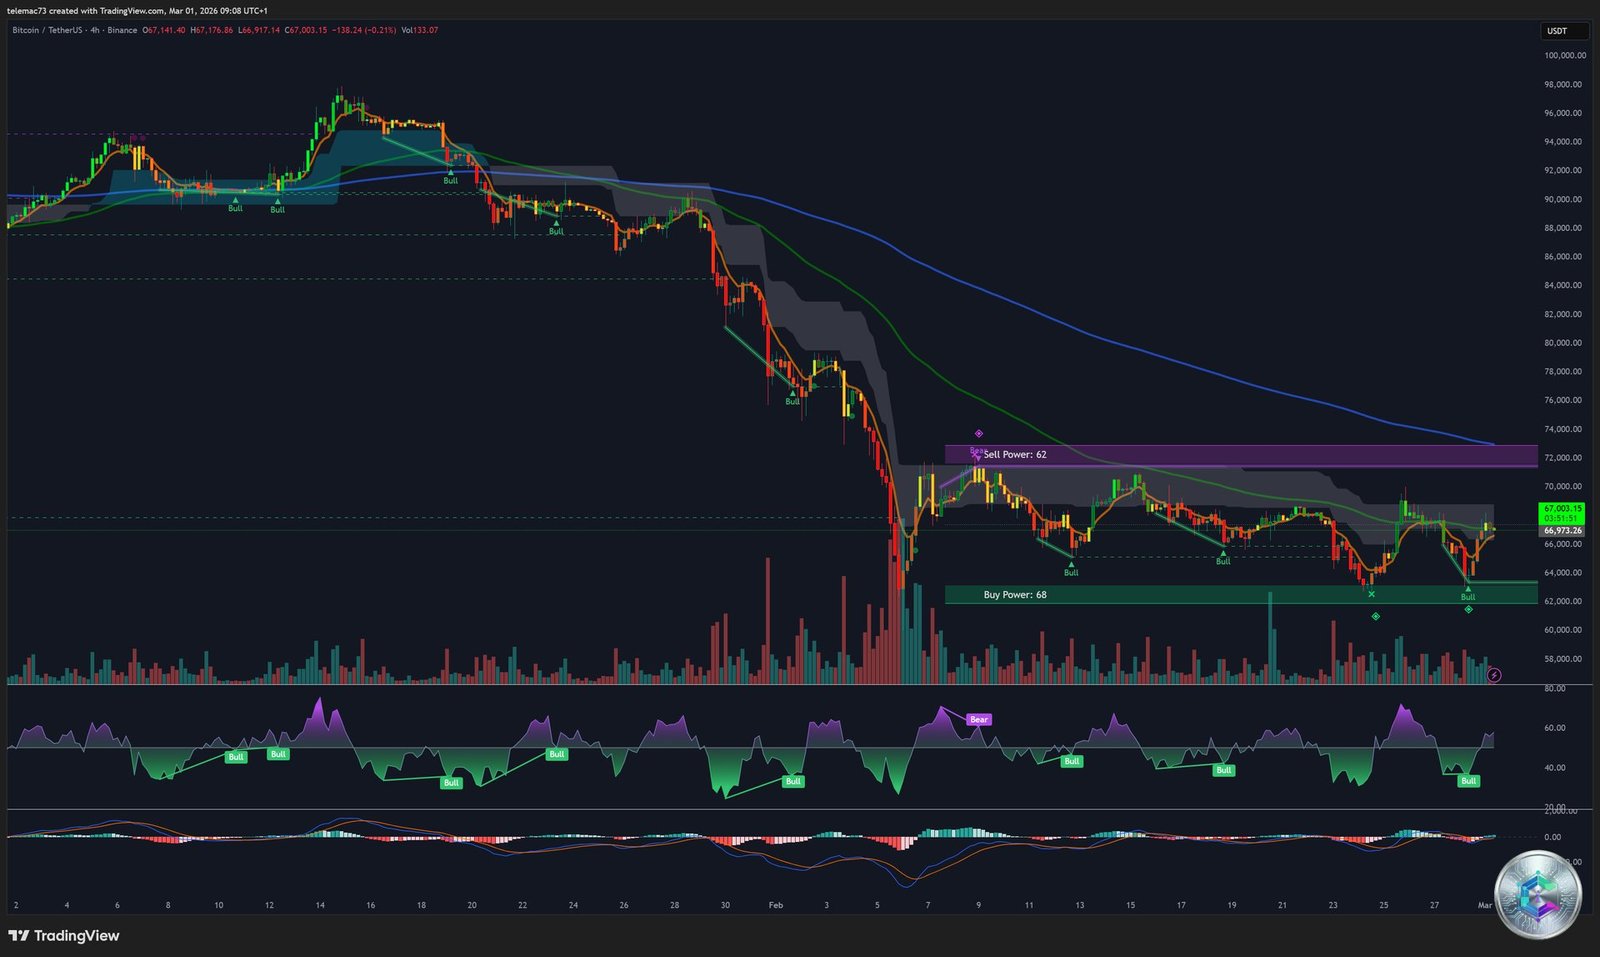
The 4-hour chart presents a more constructive structure. Price has managed to reclaim above the EMA 20 and EMA 50, which now form a bullish crossover and provide an immediate support cluster at $66,950–$67,000. However, the EMA 100 (at $68,396) is blocking upside, while the EMA 200 at $72,604 remains the ultimate target to confirm a paradigm shift. The MACD shows a bullish flip but its histogram is flattening — the market is in « early recovery » mode, not confirmed reversal.
4.3. Daily Chart: The Weight of History
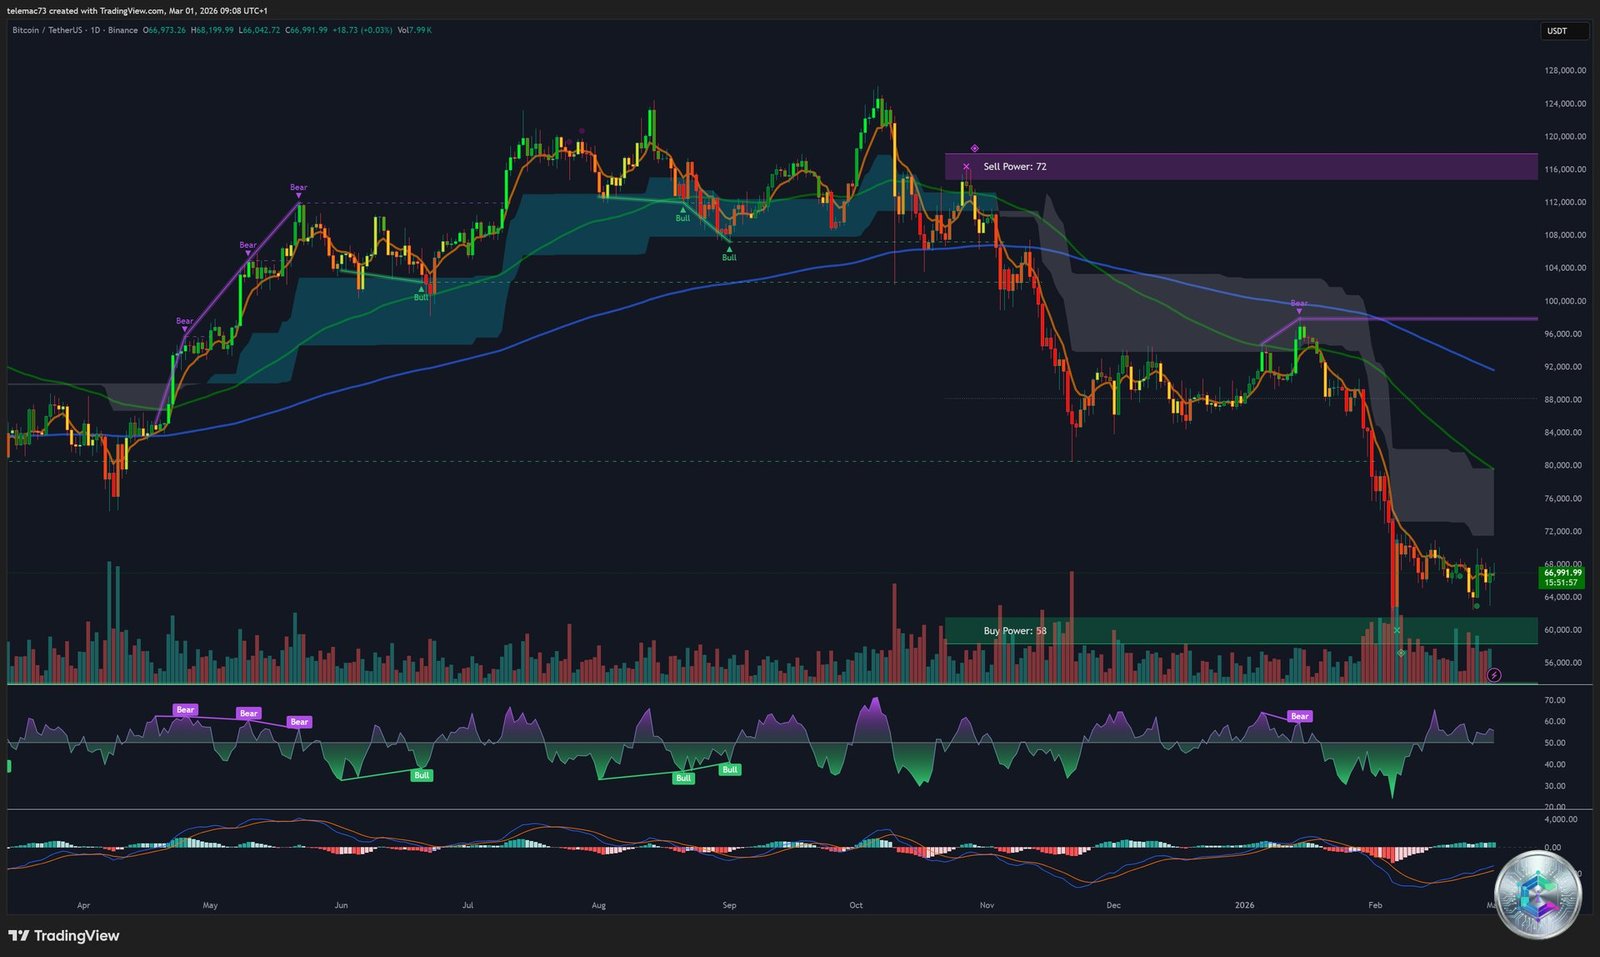
The daily chart contextualizes the severity of the medium-term bear market. Indicators are telling: dominant selling pressure (Sell Power at 72 vs. Buy Power at 38), price entangled below long-term moving averages. The 200-week EMA at $68,330 — the empirical dividing line between bull and bear cycles — forms the first wall. The psychological level of $69,000 (2021 ATH) and $70,000 have rejected price three times with surgical precision. The RSI at 57.68 leaves room before overbought, and the MACD generates a tentative buy signal, indicating bearish momentum exhaustion.
5. Key Level Mapping: Supports, Resistances and Liquidation Zones
5.1. Daily Pivot Point Matrix (March 1, 2026)
| Method | S2 | S1 | Pivot | R1 | R2 |
|---|---|---|---|---|---|
| Classic | $66,403 | $66,612 | $66,854 | $67,062 | $67,305 |
| Fibonacci | $66,576 | $66,682 | $66,854 | $67,027 | $67,133 |
| Camarilla | $66,737 | $66,778 | $66,854 | $66,861 | $66,902 |
| Woodie’s | $66,395 | $66,594 | $66,846 | $67,045 | $67,297 |
Price gravitates symmetrically around the central pivot at $66,854, confirming total market neutrality and indecision.
5.2. Critical Support Zones
The first safety net lies at the Fibonacci S1/S2 cluster between $66,400 and $66,600. The real test sits in the $65,000–$65,650 zone: a daily close below this level would open a trap door toward $63,000. Deeper, liquidation heatmaps (CoinGlass) reveal a massive concentration of long liquidations buried between $60,000 and $62,000 — a zone acting as a gravitational magnet for market-maker algorithms. A breakdown beyond that level would threaten the key macro Fibonacci retracement at $57,800, the ultimate defensive line of the secular bull market.
5.3. The Explosive Potential of a Short Squeeze
The bullish scenario is equally dramatic. Upside is immediately blocked by the EMA 100 (4H) / 200-week EMA confluence at $68,330–$68,400, followed by the formidable double ceiling at $69,000–$70,000. Beyond the technical fortress at $72,000, heatmaps reveal an exceptional concentration of short liquidations between $78,000 and $82,000. Should a catalyst propel price convincingly past $72,000, forced buying from short sellers would trigger a chain reaction capable of vertically launching Bitcoin toward $80,000 (a 15% gain) regardless of macro fundamentals.
6. Projections and Probabilistic Models
6.1. The Statistical Approach: 88% Bullish Probability Over 10 Months
Analyst Timothy Peterson, drawing on CoinGlass data, notes that a 24-month rolling window shows 50% positive months. His probabilistic model, extrapolated since 2011, establishes an 88% probability that Bitcoin’s price will be higher 10 months from now, with a theoretical average return pointing toward a target of $122,000.
6.2. Elliott Wave Analysis: The 2026–2028 Roadmap
Long-term cyclical modeling projects: a broadly bullish or consolidating Q1 2026 with a local peak expected by April at the latest, followed by a structurally severe bearish phase for Q2–Q3 2026, culminating in a potential capitulation point in July or October 2026. Late 2026 would form the base of a laborious accumulation phase, preparing the ground for a super-cycle bull run unfolding in 2027–2028.
7. The Regulatory Detonator: The « Crypto Clarity Act »
All models converge on a single decisive catalyst: the outcome of negotiations around the Crypto Clarity Act, whose White House deadline falls on March 1, 2026. This historic legislation aims to give the United States a comprehensive legal framework for digital assets, classifying Bitcoin and other mature cryptocurrencies as « digital commodities » rather than securities subject to SEC oversight.
The stakes are enormous. Adoption of the Clarity Act would represent the most powerful catalyst for the industry since spot ETF approval. Infrastructure is already in place: BNY Mellon already custodies Ripple’s RLUSD stablecoin, JPMorgan is deploying its Onyx blockchain network, while Goldman Sachs and Fidelity are building industry consortia for asset tokenization. Ripple CEO Brad Garlinghouse puts the odds of passage at 80% by April. If the legislation fails, broad institutional adoption risks being postponed indefinitely, collapsing a major narrative pillar supporting current valuations.
Strategic Summary: A Market at Its Hour of Truth
Bitcoin on March 1, 2026 is caught between two forces of equivalent intensity:
Bearish forces: toxic macro environment (tariffs, geopolitics), massive supply overhang (9.2 million BTC underwater), multiple technical resistances below the 200-week EMA, and exacerbated volatility constraining positioning.
Bullish forces: spectacular return of ETF flows (+$750M in 48H), a 41% fundamental discount versus the modeled fair value of $95,000, explosive short-squeeze potential toward $80,000, and an unprecedented institutional safety net via the U.S. Strategic Reserve.
The catalyst that will break this standoff likely lies neither in order books nor in technical indicators, but in Washington’s halls of power. The outcome of the Clarity Act and the Fed’s rhetoric at its mid-March conclave will dictate the quarter’s directional bias. Operators should approach upcoming sessions with strict risk management, fully aware of the extreme asymmetry and imminent volatility characterizing this historic market structure.
⚠️ Disclaimer: This article is written for educational and informational purposes only. It does not constitute investment advice, or a recommendation to buy or sell digital assets or any other financial instrument. Cryptocurrency markets are extremely volatile and carry risks of total capital loss. Always conduct your own research (DYOR — Do Your Own Research) and consult a qualified financial advisor before making any investment decision.