
Bitcoin is navigating one of the most complex re-pricing phases in its recent financial history. After reaching an all-time high of $126,080 in October 2025, the asset has corrected by nearly 50% over five consecutive months, pulling prices back toward the critical threshold of $60,000. This report dissects with surgical precision the anatomy of this market: macroeconomics, institutional flows, price microstructure, and forward-looking scenarios.
1. Market Overview: A Structure Under Extreme Pressure
As of late February 2026, Bitcoin is trading in an extremely volatile range. Recent spikes briefly pushed prices toward $68,164 driven by short squeezes and macroeconomic announcements, but the underlying exchange microstructure shows an asset struggling to hold between $63,900 and $65,865.
Total crypto market capitalization holds around $2.35–$2.44 trillion, with daily trading volumes frequently exceeding $106 billion. Bitcoin dominance stands at 56.12%, while Ethereum (ETH) structurally underperforms at 9.92% with a price around $1,930.
The Fear & Greed Index has collapsed to 11/100 — a level of « Extreme Fear » rarely seen outside systemic end-of-cycle capitulations. Historically, such pessimism often precedes major trend reversals, provided the underlying macroeconomic structure allows for it.
2. Macroeconomic Environment: A Persistent Risk Premium
2.1. The Federal Reserve and Rate Anchoring
The primary structural headwind lies in the Fed’s unwavering stance. The hope for rapid monetary easing — which had fueled the rally toward $126,000 in 2025 — was dashed by persistent core inflation. The next rate cut is now projected for July 2026, with very high statistical uncertainty.
This « higher for longer » policy keeps the risk-free rate at an attractive level for institutional capital, mechanically increasing the opportunity cost of holding non-yielding assets like Bitcoin. The nomination of Kevin Warsh as Fed Chair injected additional volatility into global risk equations.
2.2. Positive Catalysts: The State of the Union Address
Paradoxically, Donald Trump’s State of the Union address in late February served as a short-term tactical catalyst. By highlighting core inflation cooling to 1.7% over Q4 2025, the administration temporarily reassured macro trading algorithms, triggering a simultaneous rally in the Nasdaq, S&P 500, and Bitcoin — the latter recording an intraday surge of +6%.
2.3. Geopolitical Tensions and Legal Shocks
Middle East geopolitical uncertainty and the Supreme Court ruling declaring most Trump-era tariffs unconstitutional generated immediate volatility in forex and commodity markets, forcing indiscriminate liquidation of liquid assets — Bitcoin included.
3. Regulatory and Technological Developments
3.1. The Federal Investigation into Binance: A Systemic Stress Test
The most seismic event occurred on February 28, 2026: Senate Democrats formally demanded a federal investigation into Binance, the world’s largest crypto exchange, over alleged failures in its Anti-Money Laundering (AML) controls. The market reacted immediately with a 2.33% drop to $65,865.
This investigation is not merely an isolated legal risk. Since Binance centralizes a massive share of global order flow and acts as the de facto clearing house for derivatives markets, any severe sanctions would cause immediate fragmentation of institutional liquidity, widening spreads and exponentially increasing structural volatility.
3.2. Coinbase and the Prediction Markets War
Coinbase’s head of litigation publicly accused several U.S. states of regulatory « gaslighting » regarding blockchain-based prediction markets. This battle highlights the toxic regulatory fragmentation across the U.S., hampering innovation and long-term institutional capital deployment. Decentralized prediction markets currently price only a 3% probability of Bitcoin reaching $150,000 by June 2026.
4. Institutional Flows: The Spot ETF Effect
4.1. A Systemic Capital Flight (January–February 2026)
The correction from the October 2025 ATH was amplified by a negative feedback loop unique to the ETF era. Over the five weeks leading up to late February, Bitcoin ETFs recorded consecutive net outflows totaling $3.8–$4.3 billion. Large macro hedge funds slashed up to 28% of their cumulative positions. Open Interest collapsed by 58%, falling from a peak of $56.6 billion to levels between $16 and $45 billion.
4.2. The Spectacular Return of Smart Money
Late February marked a spectacular break in this trend. On February 24, spot ETFs recorded $257.7M in net inflows — snapping the streak of daily redemptions. On February 25, inflows exploded to $506.5M, the highest single-day accumulation in three weeks. In just 48 hours, over $750 million in fresh capital poured into regulated crypto vehicles.
| ETF (Ticker) | Asset Manager | Net Flow (Feb 25, 2026) | Key Observations |
|---|---|---|---|
| IBIT | BlackRock | +$297.4M | Systemic market dominance — 60% of daily flows |
| GBTC | Grayscale | +$102.5M | Rare reversal — signals total seller exhaustion |
| FBTC | Fidelity | +$83.0M | Continued RIA network penetration |
| BITB | Bitwise | +$39.4M | Growing market share among crypto-native issuers |
| Total (11 ETFs) | — | +$506.5M | Perfect buyer alignment — zero net outflows across panel |
Remarkably, none of the 11 active ETFs recorded net outflows that session. Despite a 50% drawdown from the ATH, total ETF outflows of ~$6.5B represent a tiny fraction of the $55–107B in cumulative inflows since launch — institutional diamond hands of extraordinary strength.
5. Order Book Microstructure & Heatmap Analysis
Analysis of the TapeSurf heatmap for the Binance BTC/USDT market reveals a battleground of extreme tension:
- Above market: A massive wall of sell orders between $72,450 and $75,000 (~$2 billion in ask liquidity), with dense pockets beginning at $69,000.
- Below market: Layers of bid orders from $63,000 to $60,000, but with a systemic danger: $1.22 billion in heavily leveraged long positions clustered between the current price and $60,000.
If Bitcoin loses its $66,296 support on a sustained basis, liquidation engines will trigger cascading margin calls in an order book whose depth has shrunk by 65%. Conversely, any bullish nibbling at resistance levels can trigger a violent short squeeze — as evidenced by the +6% bounce fueled by $323M in forced short covering.
6. Multi-Timeframe Technical Analysis
6.1. 15-Minute Chart: Local Capitulation
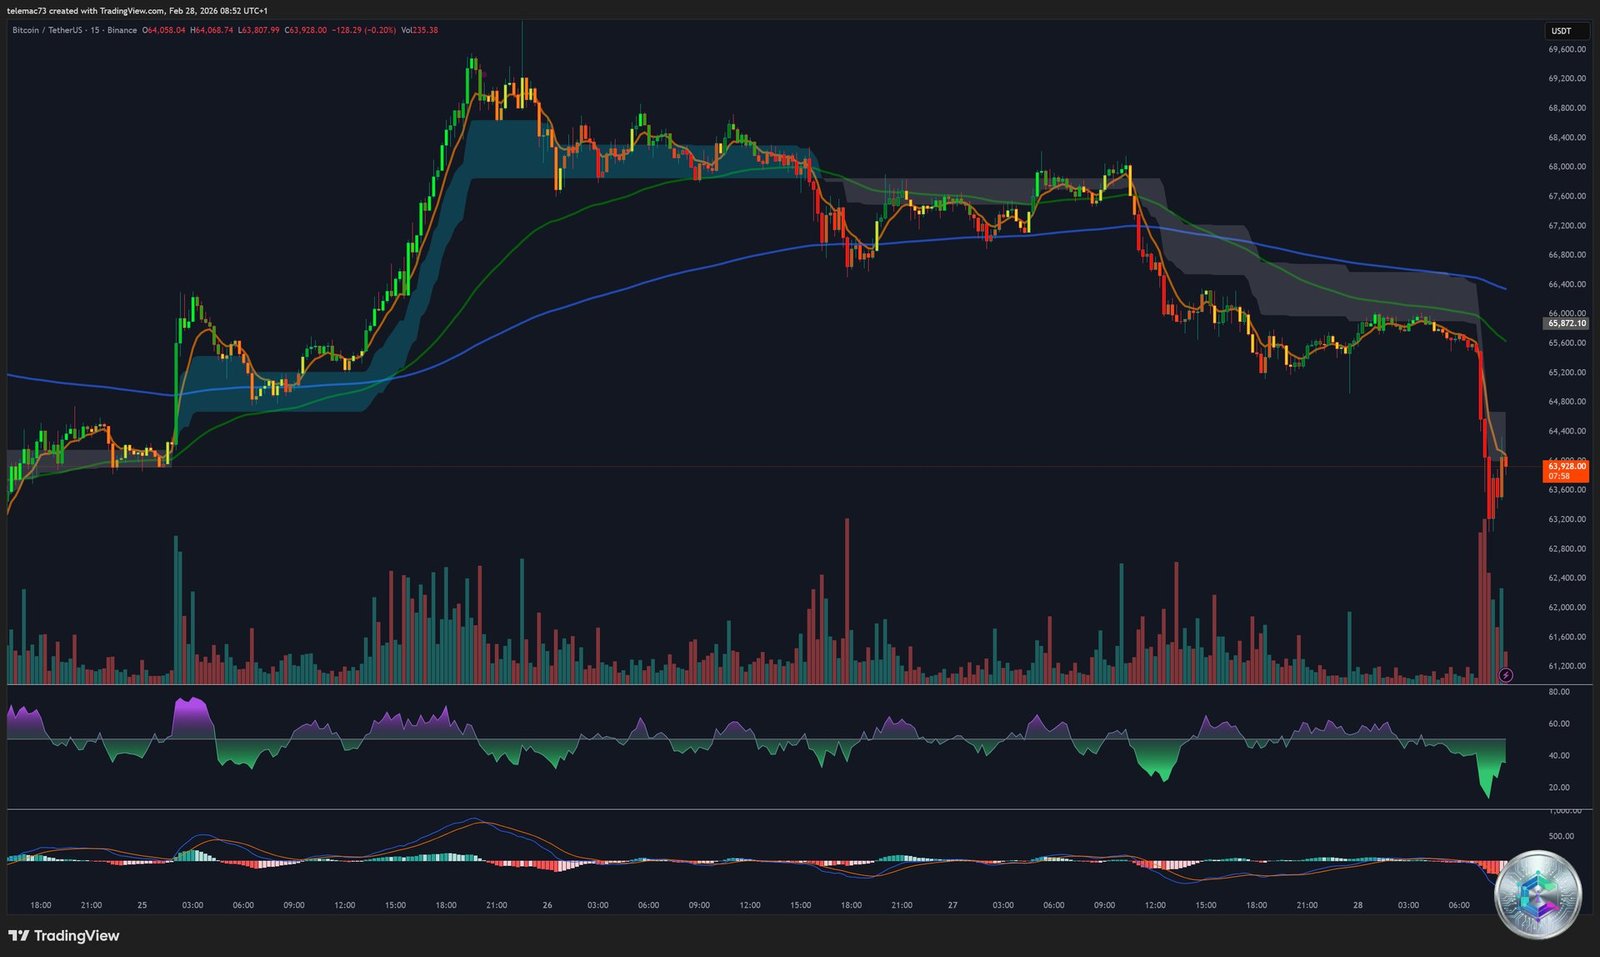
The 15-minute chart illustrates the extreme stochastic volatility that is the exclusive playground of HFT algorithms. A violent red candle captures a flash crash from $66,000 to $63,908 — accompanied by an outsized volume bar, the irrefutable signature of a cascading liquidation event or orchestrated stop-loss hunt. The RSI plunges into extreme oversold territory before a minor technical bounce.
6.2. 4-Hour Chart: Stabilization Attempt
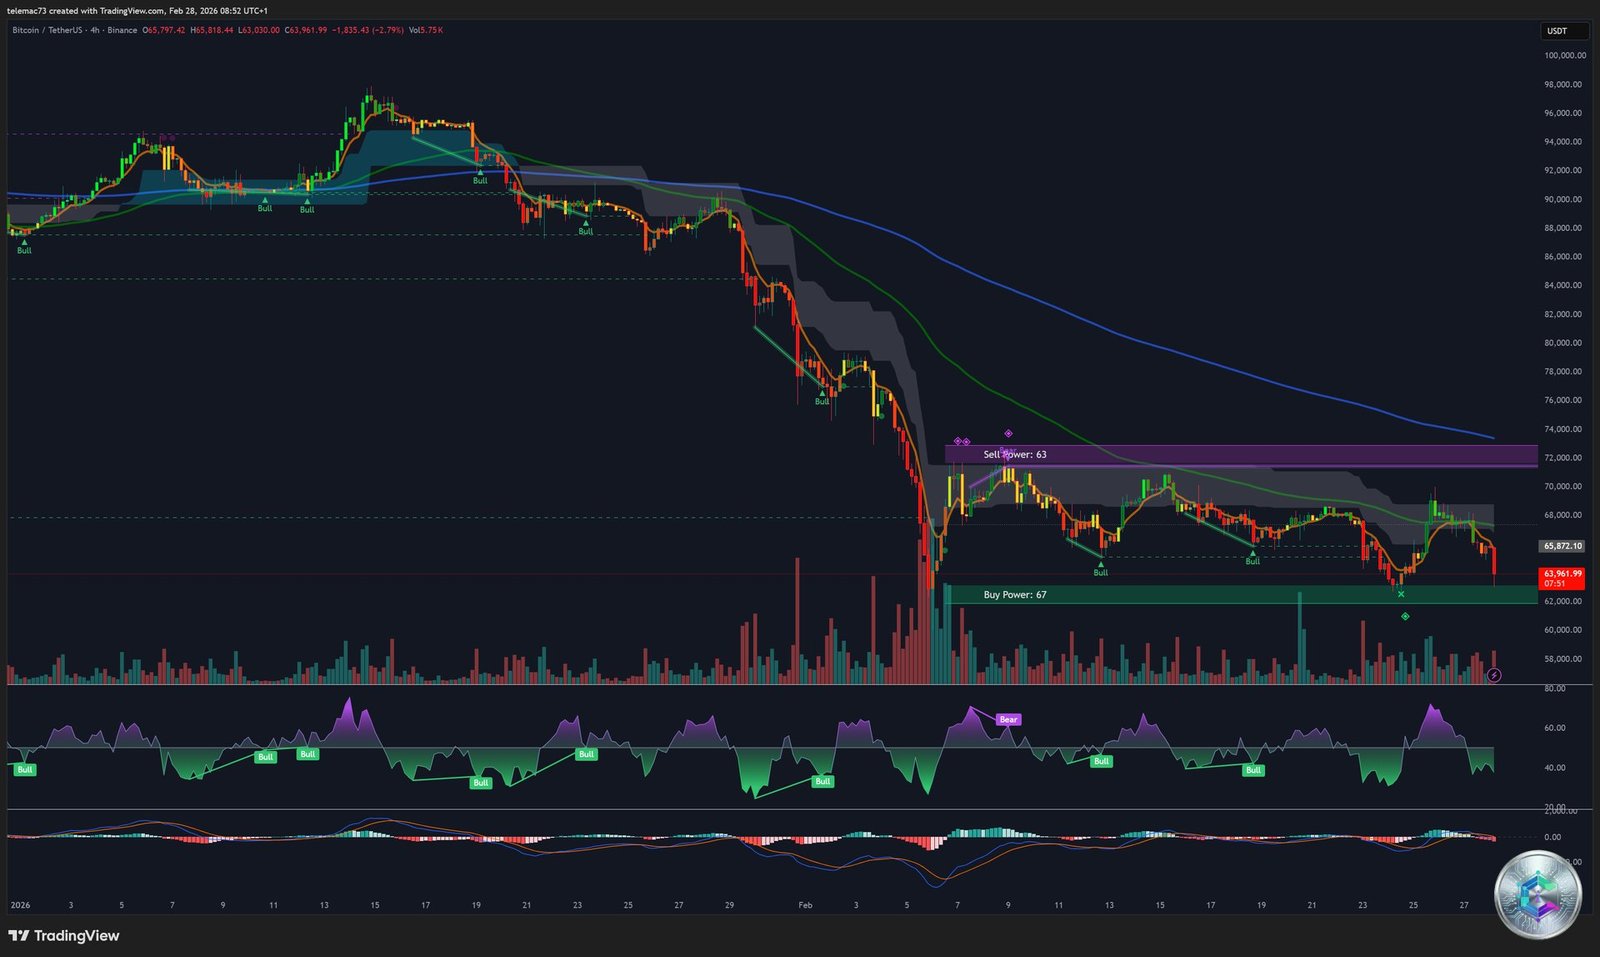
The 4-hour chart shows a relentless staircase decline from the $94,000–$96,000 zone. Ichimoku confirms a decidedly bearish Kumo acting as crushing dynamic resistance. However, a subtle shift is emerging: Buy Power (67) now slightly exceeds Sell Power (63), suggesting covert VWAP accumulation algorithms are absorbing supply. A potential Higher Low at $64,758 could mark the beginning of a trend reversal — but until $69,000 is definitively broken, the market remains trapped in toxic compression.
6.3. Daily Chart: Critical Resistances
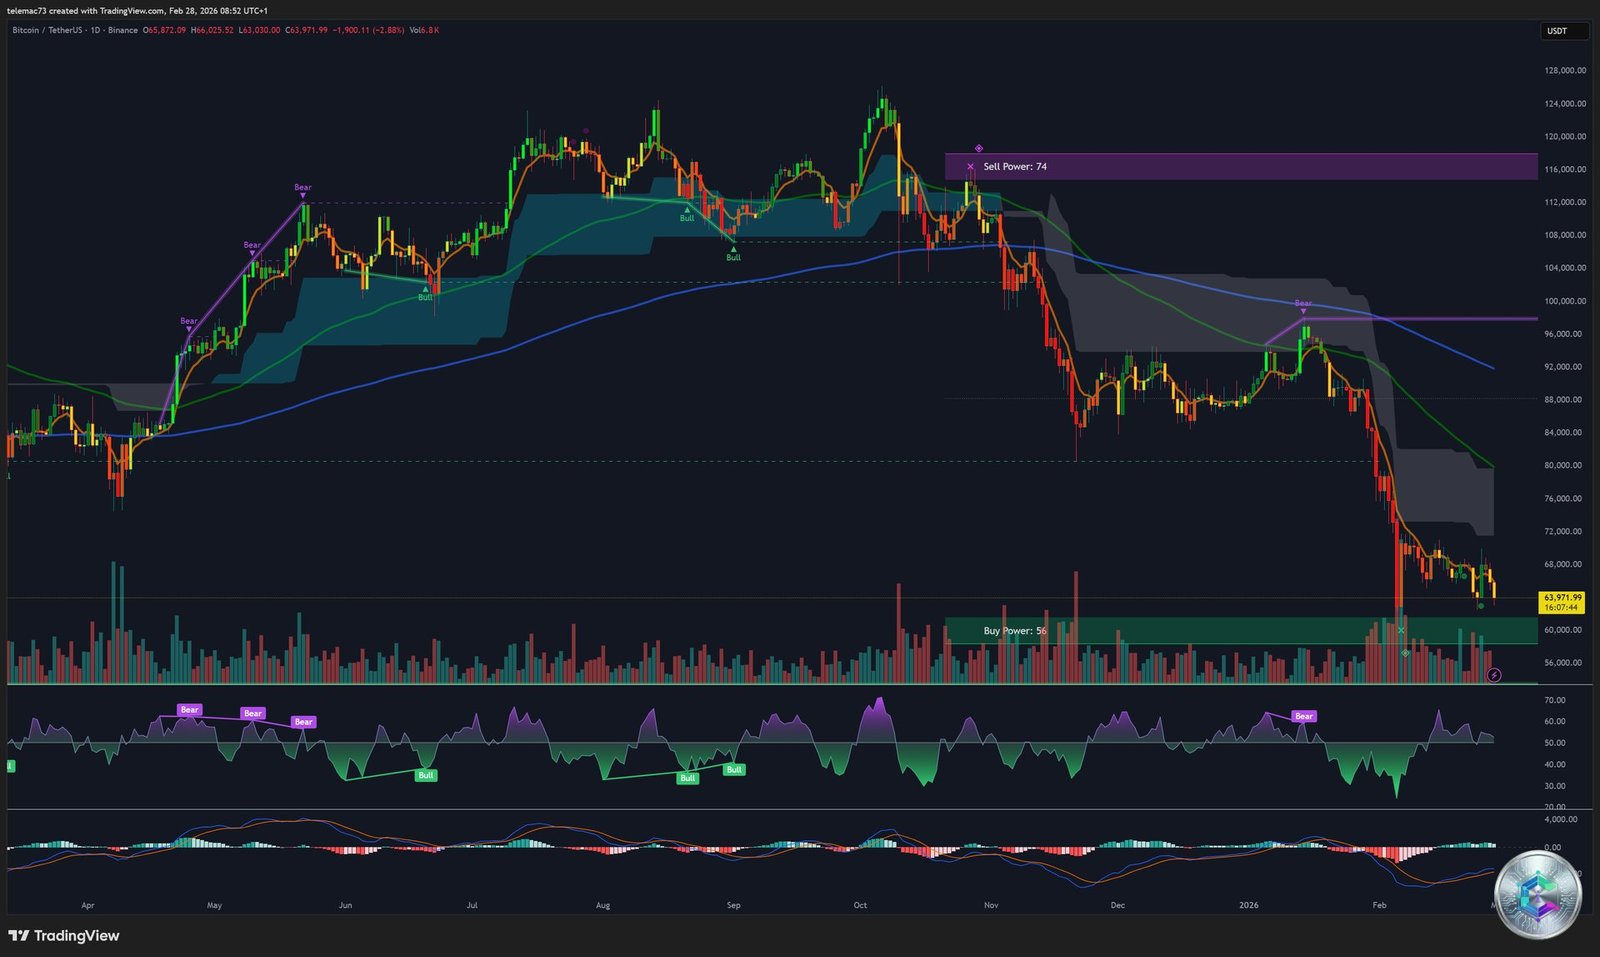
On the daily timeframe, price is displayed at $63,971. The Ichimoku Kumo is wide, thick, and bearish. The most critical macro resistance sits between $68,000 and $70,000, reinforced by the 200-week EMA at $68,330 — the absolute demarcation line between bull and bear markets. RSI at 42.01, MACD at -417.9, and the bearish pennant pattern confirm the total absence of structural buying momentum.
6.4. Key Technical Levels Summary
| Price Level ($) | Type | Description |
|---|---|---|
| 126,080 | ATH / Historical Resistance | Absolute peak of October 2025 |
| 90,000–95,000 | Long-Term Pivot Resistance | Former distribution plateaus (H4) |
| 72,450–75,000 | Ceiling / Sell Wall | ~$2B in ask liquidity (Heatmap) |
| 68,330–70,000 | Critical Dynamic Pivot | 200W EMA + Bull/Bear psychological resistance |
| 66,296 | Short-Term Pivot Support | Bull control line — loss triggers liquidation cascade |
| 63,900–64,758 | Intermediate Support | Last structural Higher Low being defended |
| 60,000–62,000 | Macro Support / Red Line | Trigger zone for $1.22B long liquidation cascade |
| 50,000–53,000 | Bearish Target | Major retracement — August 2024 lows |
7. The 2018–2019 Fractal Analogy & 2026 Scenarios
The current sequence — five consecutive red monthly candles, massive derivatives deleveraging, and sentiment at rock bottom — meticulously replicates the late 2018 setup. Back then, after an identical purge, Bitcoin found a structural accumulation floor in January 2019, followed by five consecutive green monthly candles generating +317% (from $3,329 to $13,880).
Scenario 1 — Latent Accumulation (Base Case)
The $60,000–$62,000 support holds on a weekly closing basis. The market oscillates between this floor and $72,000–$74,000. Persistent macro uncertainty (Fed, inflation) suppresses any bullish breakout. Institutional players accumulate quietly via VWAP algorithms while the last retail investors capitulate out of boredom.
Scenario 2 — Systemic Capitulation (Risk Case)
If the Binance investigation results in crippling sanctions, or if the Fed unexpectedly raises its rate projections, $60,000 gives way. The cascading liquidation of $1.22B in long positions creates an air pocket toward $50,000–$53,000 in a 65%-depleted order book. This scenario would, however, represent the last asymmetric allocation opportunity of the decade.
Conclusion: At the Crossroads
Bitcoin at the dawn of March 2026 is torn between a severely damaged market microstructure and an institutional resilience of exceptional robustness. The coordinated injection of $750M in just 48 hours confirms that Wall Street’s smart money perceives the $60,000–$65,000 zone as a deep value zone.
Nevertheless, until the 200-week EMA at $68,330 and the $70,000 wall are decisively broken on a weekly close with strong volumes, any bounce remains purely technical. The first side to break — longs at $60,000 or shorts above $70,000 — will trigger a directional move of absolute violence. Disciplined risk management is the only reliable compass in this highly toxic market regime.
⚠️ Disclaimer: This article is written for educational and informational purposes only. It does not constitute investment advice or a recommendation to buy or sell any digital assets. Investing in cryptocurrencies involves significant risks and may result in the total loss of capital invested. Please consult a licensed financial advisor before making any investment decisions.