
The digital asset market is navigating an extraordinarily complex structural transition as February 2026 draws to a close. Having reached a stunning all-time high above $125,000 in October 2025, Bitcoin has since endured a severe ~50% correction, oscillating erratically between $60,000 and $70,000. This report delivers a multidimensional analysis — macroeconomic, institutional, and technical — to map the probable trajectories heading into Q1 2026.
🌍 Macroeconomic Architecture: Tariffs, the Fed and Sticky Inflation
Bitcoin’s price action in February 2026 is structurally inseparable from the macroeconomic shockwaves that have redefined global risk appetite. The Trump administration imposed sweeping new tariffs under Section 122 of the Trade Act of 1974 — initially set at 10% before being unilaterally raised to 15% — locked in for 150 days through July 24, 2026. For crypto markets, this nascent trade war presents a systemic binary risk: sticky imported inflation would mechanically force the Federal Reserve to maintain a restrictive « higher-for-longer » stance, acting as a gravitational headwind for high-beta assets like Bitcoin.
Initial jobless claims at 212,000 (vs. 215,000 expected) underscore labor market resilience. Hawkish FOMC members Waller and Bostic reiterated extreme caution around a potential second inflation wave, pushing June 2026 rate-cut odds sharply lower. The key event remains the PPI report released February 27, 2026: a hot print validates « higher-for-longer » and drains crypto liquidity; a soft print reopens the door to easing and fuels a relief rally.
Two unexpected bullish catalysts provided a meaningful floor: NVIDIA’s blowout Q4 earnings (validating the AI infrastructure bull market) and Donald Trump’s State of the Union address — the longest in presidential history — which injected $52 billion in fresh capital into the crypto ecosystem within hours, propelling BTC above the $66,000 resistance.
🏦 Institutional Flow Dynamics: ETF Hemorrhage and the Dramatic Reversal
Bitcoin’s evolution is now intrinsically tied to the flows of US-listed spot Bitcoin ETFs. Since January 1, 2026, total AUM across all spot Bitcoin ETFs has cratered by 30.5%, from nearly $117 billion to approximately $81.3 billion. Over five consecutive weeks, these vehicles suffered net redemptions of $3.8–4.3 billion — creating a staggering year-over-year « buying gap » of roughly $6.9 billion compared to the same period in 2025.
The reversal was sudden and violent: ETFs logged $257.7M in net inflows on a Tuesday, erasing the $203.8M outflows from the prior Monday, before exploding to a historic $506.5M in a single session the following Wednesday. Over just 48 hours, over $760M in fresh liquidity flooded in. BlackRock’s IBIT led with $297.4M, followed by Fidelity’s FBTC and Bitwise’s BITB. Daily volumes exceeding $4.3 billion confirm this is strategic institutional re-allocation — not retail FOMO.
| ETF | Net Inflows (Rebound Session) | Structural Role |
|---|---|---|
| BlackRock iShares (IBIT) | +$297.4M | Undisputed leader, primary institutional gateway |
| Fidelity Wise Origin (FBTC) | +$30.1M – +$83M | Strong penetration among financial advisors |
| Bitwise Bitcoin ETF (BITB) | +$39.4M | Preferred alternative for competitive fees |
| Total (Record Session) | +$506.5M | Strongest single-day inflow since early February |
⚖️ Market Microstructure: The Jane Street Lawsuit and the End of the « 10 A.M. Dump »
An explosive civil lawsuit filed by the Terraform Labs bankruptcy administrator against Jane Street Capital has rattled the ecosystem’s foundations. The firm is accused of insider trading and market manipulation during the Terra/Luna collapse of May 2022 — exploiting non-public information shared through a secret messaging channel dubbed « Bryce’s Secret » to dump 85 million UST onto an already-fragile Curve liquidity pool, triggering the death spiral that wiped out over $40 billion in market cap. The most extraordinary detail: the very moment this lawsuit hit the headlines, the recurring algorithmic anomaly known as the « 10 A.M. Bitcoin dump » simply vanished from intraday charts. The resulting purification of market microstructure directly paved the way for the +10% technical rebound from local lows.
📊 Multi-Timeframe Technical Analysis
Daily Chart — The Macro Structure
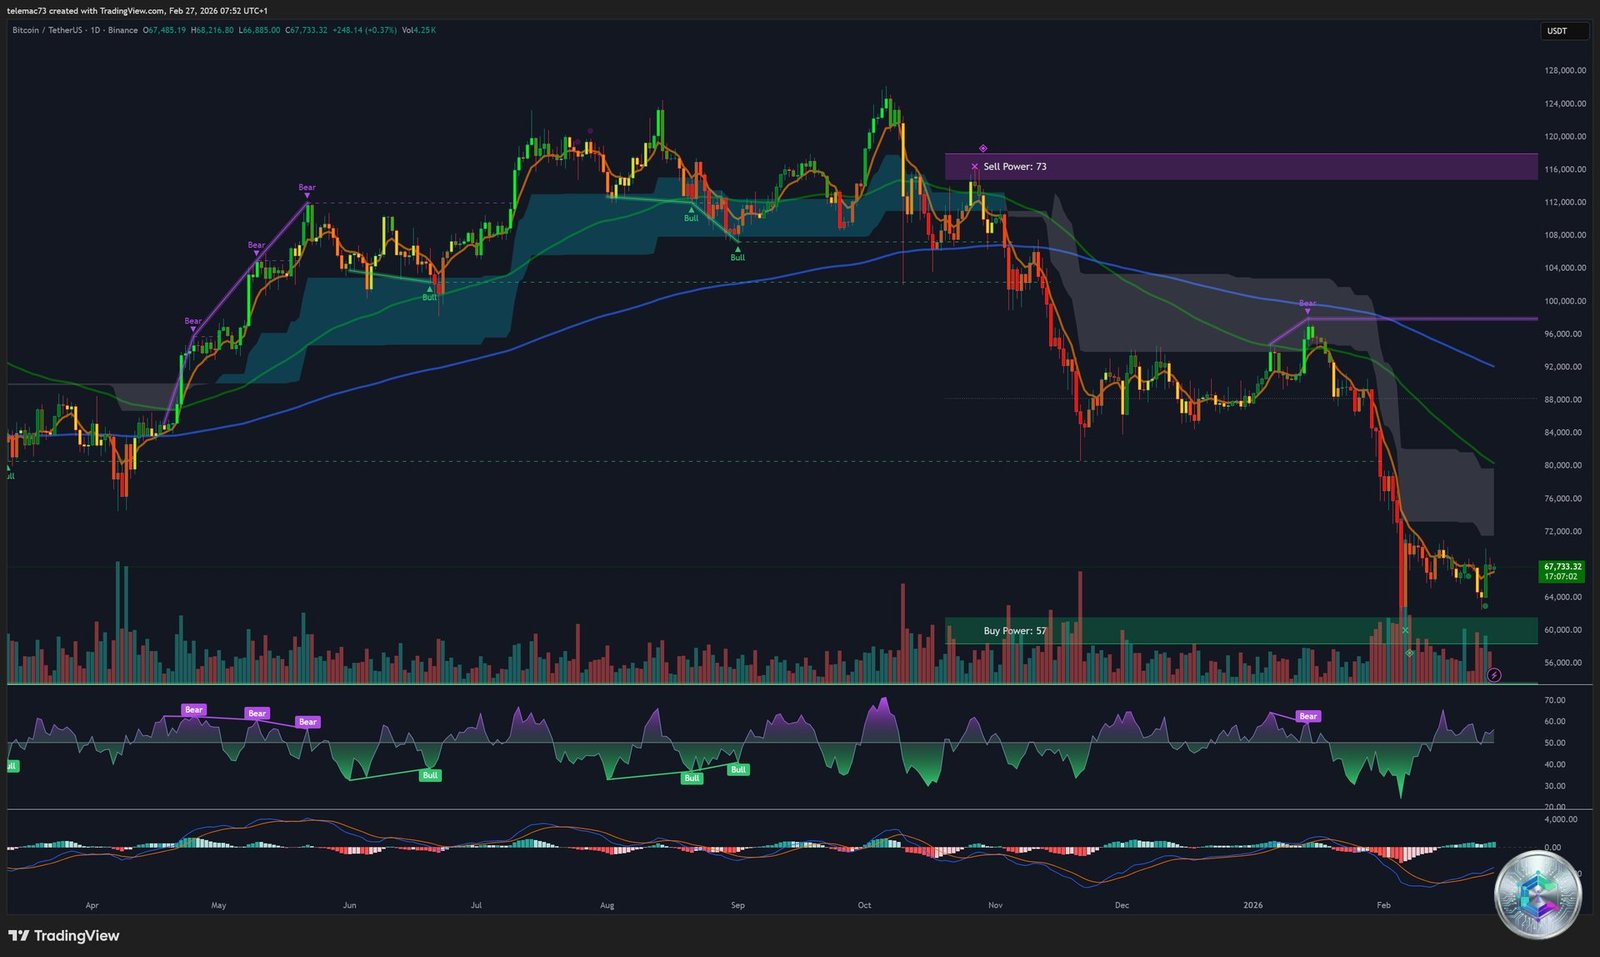
The daily chart traces the formation of a massive distribution structure between $120,000 and $125,000, flagged by a « Sell Power: 73 » signal near $116,000. The subsequent collapse fractured every short- and medium-term moving average, only exhausting at $60,000 – $62,000 — a level corresponding precisely to the Fibonacci 0.786 retracement, widely regarded as the final defense before a macro bull trend is invalidated. Volume bars at this support show expanding buy-side participation, the unmistakable fingerprint of institutional accumulation. The RSI 14 sits at 48.5 (neutral), while the Stochastic (9,6) already reads 98.85, reflecting the violence of the initial bounce.
| Indicator | SMA | EMA | Signal |
|---|---|---|---|
| MA50 | ~$67,275 | ~$67,213 | Support forming |
| MA100 | ~$66,047 | ~$66,815 | Solid base (Buy) |
| MA200 | ~$66,808 | ~$66,933 | Market arbiter (Buy) |
4-Hour Chart — The Double Bottom
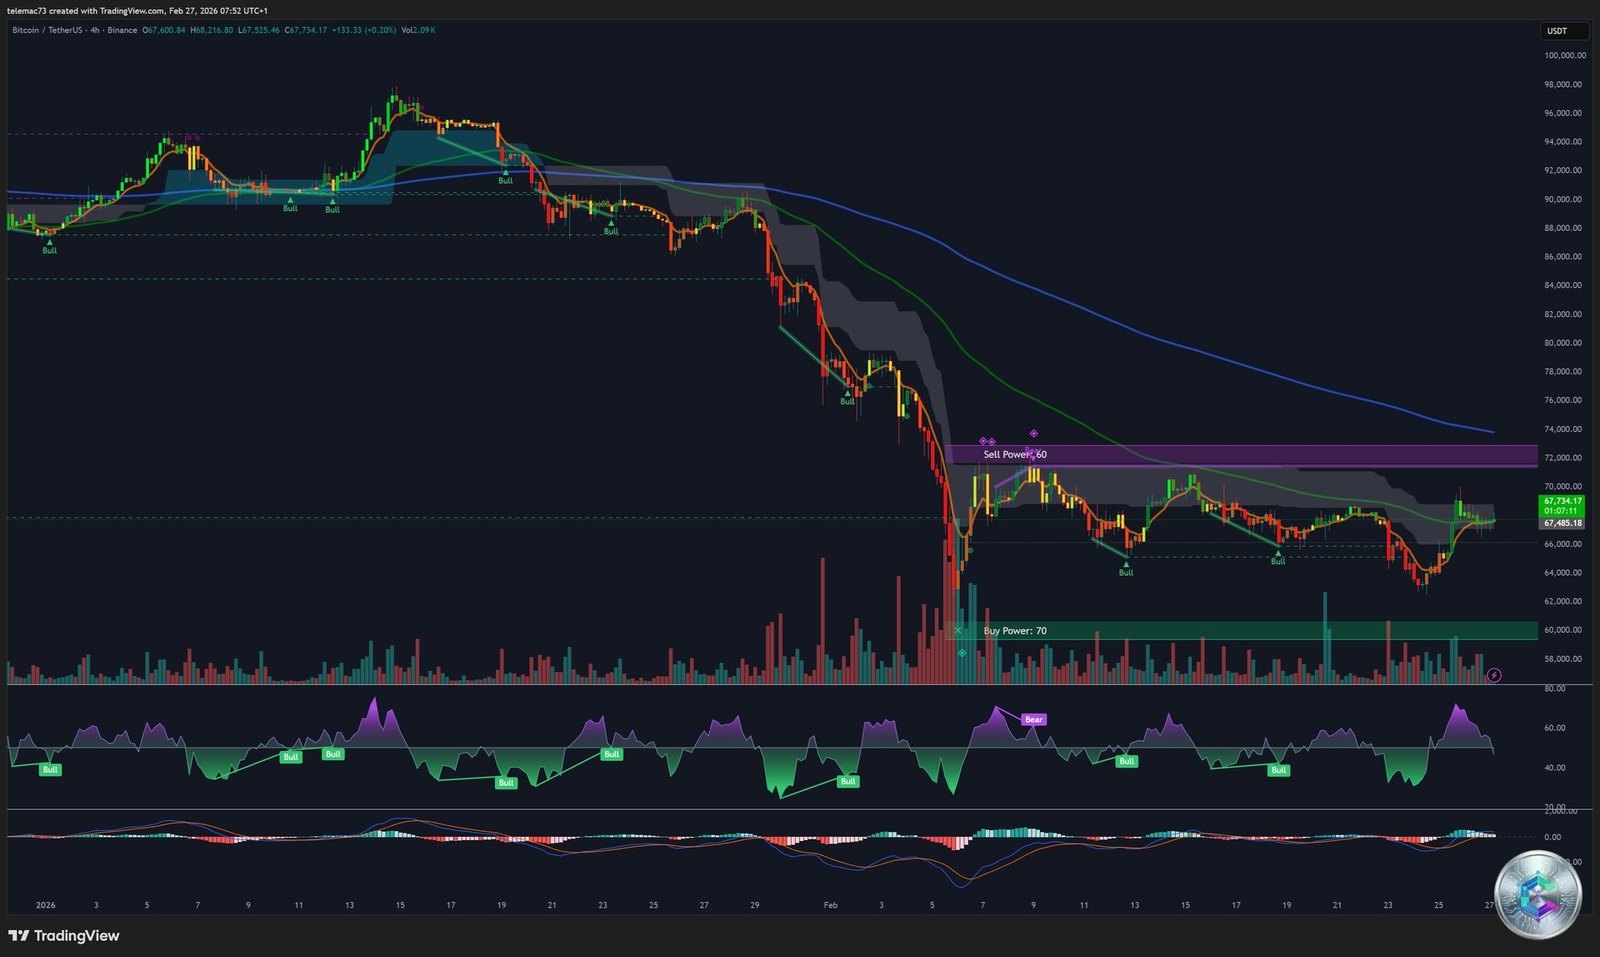
On the 4-hour timeframe (price at capture: 67,485.18 USDT), the chart highlights a near-surgical Double Bottom (W-pattern) formed on the $63,000 support, which served as the launch pad for a ~10% impulsive rally. Price is now attacking the lower boundary of the trend cloud (EMA Ribbon), attempting a structural shift from bearish to bullish. Key annotations: « Sell Power: 80 » resistance below $72,000 and « Buy Power: 70 » support in the $60,000 – $62,000 zone (coinciding with a monumental volume spike). Trend reversal confirmation requires a clean close above $69,200 – $70,000 (Double Bottom neckline).
15-Minute Chart — Microstructure and Pivot Points
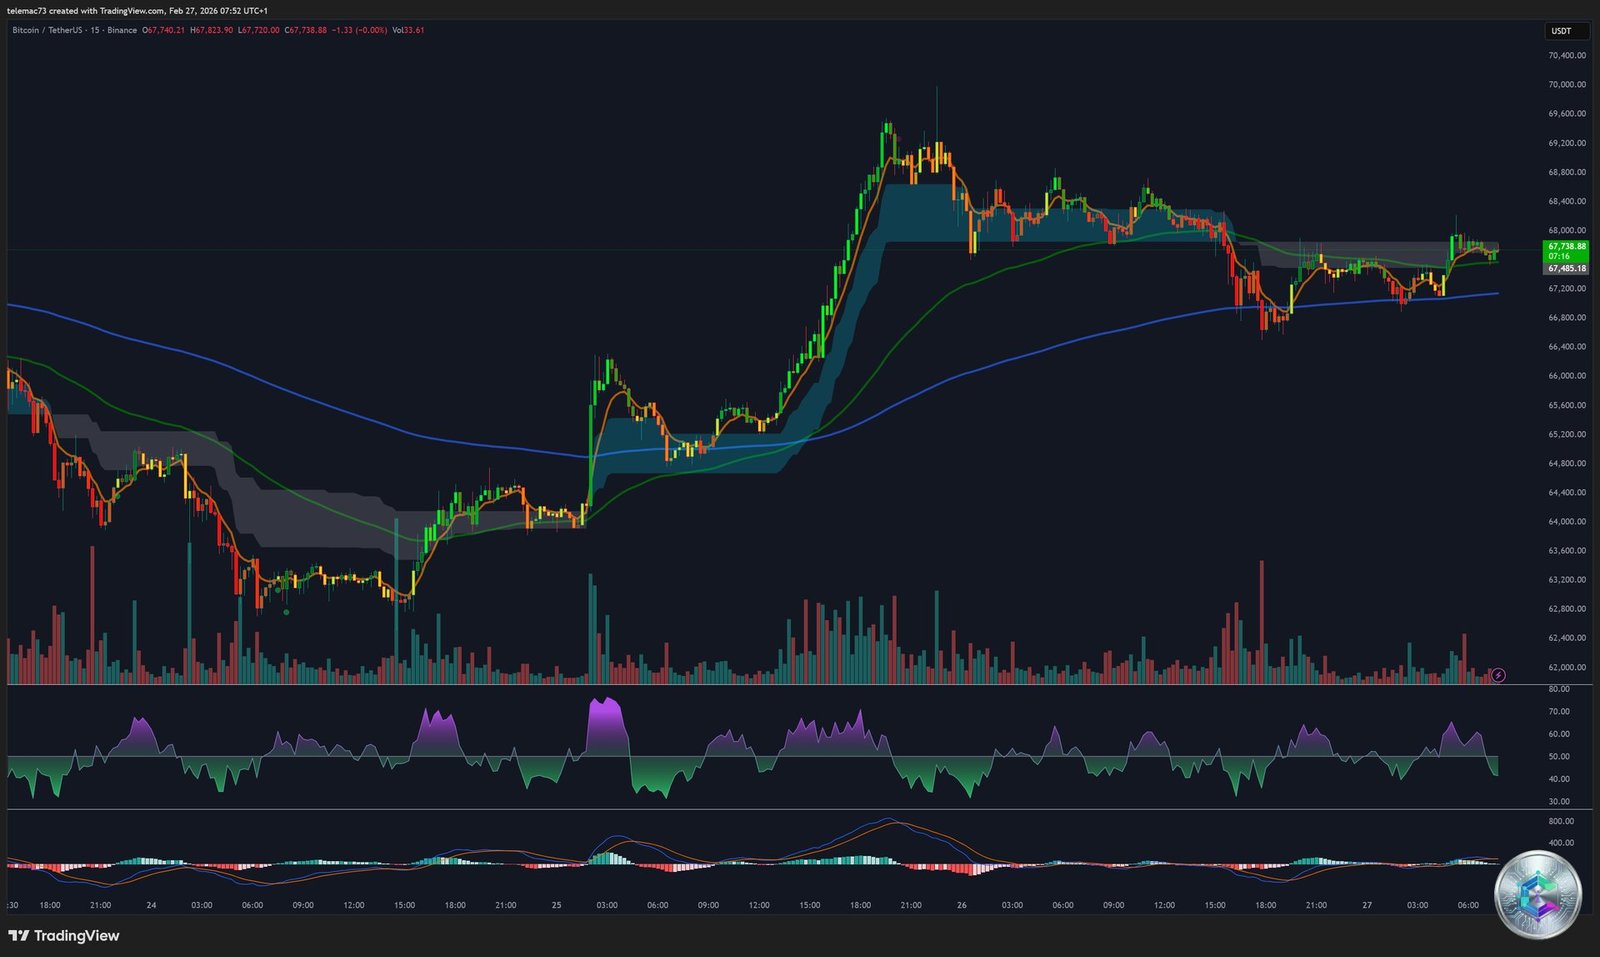
On the 15-minute chart (price: 67,738.83 USDT), the trend cloud has « twisted » bullish green and now acts as dynamic support. Price action follows classic Dow Theory: sequential Higher Highs and Higher Lows with an intraday Golden Cross on short-term MAs. Standard Pivot (P = (High + Low + Close) / 3) places immediate resistance at $68,000 and critical support at $65,000 – $65,500. A confirmed break below the pivot exposes the $62,000 floor.
🔥 Liquidity Heatmap — Mapping Gravitational Forces
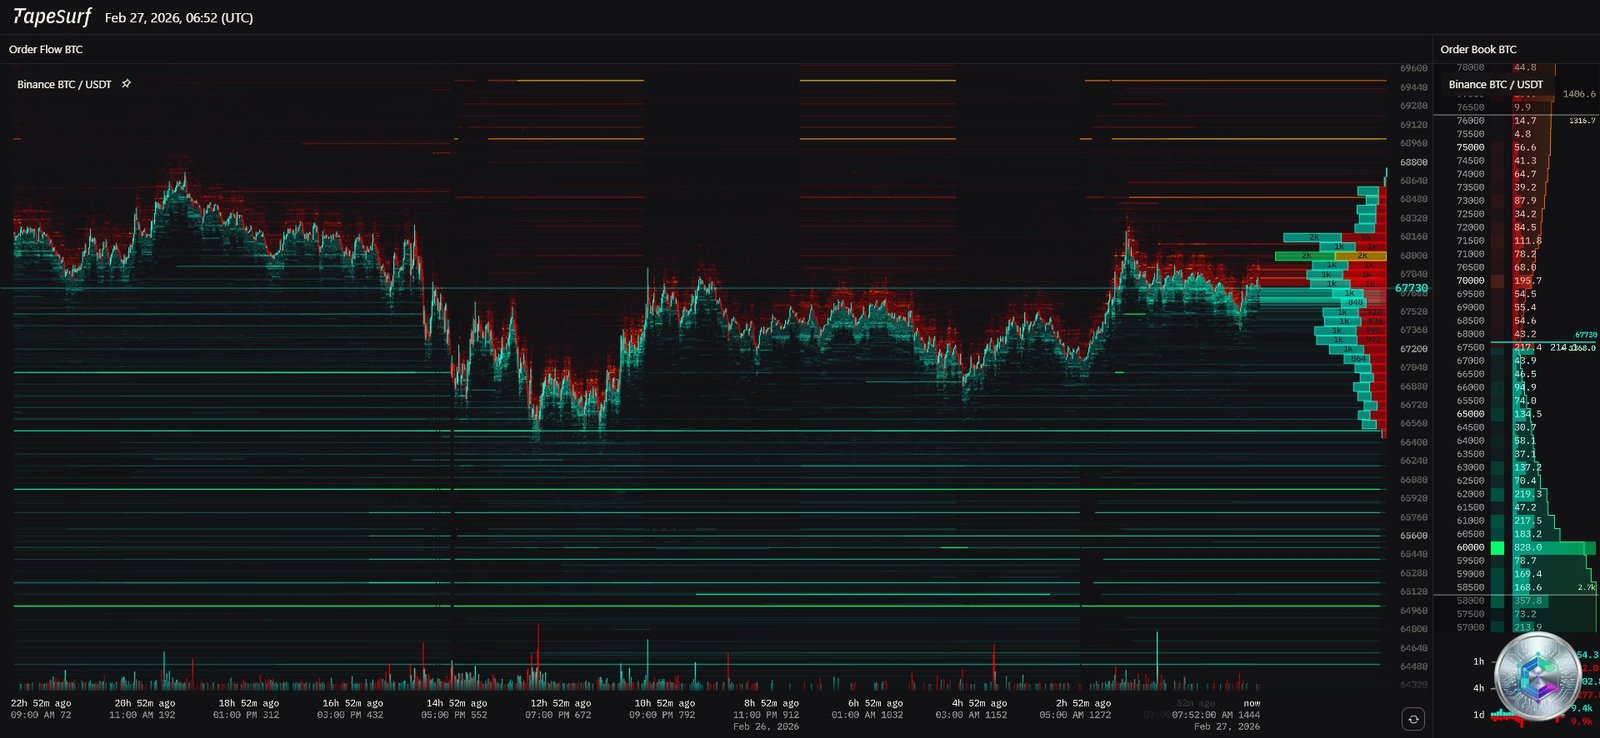
The TapeSurf heatmap (price at capture: 67,230 USDT) reveals a fascinatingly asymmetric architecture. Above current price, thick red strata (sell walls) accumulate from $68,000, intensify around $72,000, form a near-impenetrable barrier to $75,000, and culminate in extreme concentration around $80,000. Below, diffuse green bid clusters sit at $66,000, $65,000, and the $62,000 last-resort defense line.
These red clusters are not mere profit-taking orders. They represent a lethal combination: stop-loss buy orders from short sellers AND leveraged buy-stop triggers from breakout traders. If ETF demand provides sufficient kinetic energy to punch through $69,200 – $70,000 and then absorb the $75,000 liquidity pocket, the market will witness a cataclysmic short squeeze. Devoid of willing sellers (supply having been absorbed by ETFs), BTC would be propelled at thunderous velocity toward the $80,000 magnetic target. During recent bearish incursions, $420.85M in positions were liquidated in 24 hours ($342M long vs. $78.7M short), structurally cleansing the market.
🗺️ Key Levels Summary Table
| Level (USDT) | Nature | Analysis |
|---|---|---|
| $80,000 | Macro Resistance / Magnet | Heatmap final target. Culmination of a potential major short squeeze. |
| $75,000 | Intermediate Resistance | Dense sell order wall. Mechanical trigger for cascading upside liquidations. |
| $69,200 – $70,000 | Decisive Pivot (Breakout) | 4H Double Bottom neckline. Keystone of bull market recovery. |
| $67,500 – $68,000 | Local Support | Current equilibrium. Former resistance flipping to support (S1). |
| $66,000 – $66,800 | EMA/SMA Convergence | Daily SMA100 + EMA200. Bull/bear line of demarcation. |
| $62,000 – $63,000 | Historical Support (Floor) | Fibonacci 0.786. Double Bottom base. Absolute lifeline of the cycle. |
📈 Probabilistic Scenarios for Q1 2026
Base Scenario — Range Consolidation (Dominant Probability)
PPI prints broadly in line with expectations. ETF flows remain steadily positive but measured, absorbing miner supply without creating a speculative surge. Bitcoin oscillates in a macro range between the $62,000 Fibonacci floor and the $72,000 – $74,000 MA resistance ceiling. Dominant strategy: Range Trading using daily pivot points (Mean Reversion), with disciplined leverage management.
Bullish Scenario — Asymmetric Rally and Short Squeeze to $80,000
A significantly softer-than-expected PPI reignites rate-cut hopes. ETFs intensify purchases. BTC consolidates above $68,000, breaks the $69,200 – $70,000 neckline with expanding institutional volume, absorbs the $75,000 wall and triggers a mechanical short squeeze toward $80,000. Strategy: Asymmetric long bias with pre-programmed profit-taking at each resistance level.
Bearish Scenario — Macro Deterioration and Final Capitulation (Risk-Off)
An extremely hot PPI validates stagflation. DXY surges, Treasury yields pierce ceilings, ETFs resume massive outflows. BTC loses the $66,000 MA200/SMA100 confluence and pierces the Fibonacci 0.786 at $62,000, invalidating the W-structure and opening a new capitulation phase. Defensive strategy: OTM Put options or rotation into cash and short-term T-bills.
⚠️ Disclaimer: This article is intended for educational and informational purposes only. It does not constitute investment advice or a recommendation to buy or sell any digital asset. Cryptocurrency markets are highly volatile and carry significant risk of capital loss. Please consult a licensed financial advisor before making any investment decisions.