
As of February 25, 2026, Bitcoin (BTC/USD) is navigating one of its most historically severe corrections. The flagship crypto asset has contracted by approximately 50% from its all-time high (ATH) set in October 2025, which peaked in the $124,000–$126,000 range. BTC is currently consolidating precariously around $63,000–$65,000, having recently printed an intraday low of $62,964 before a modest recovery attempt. This drawdown marks the worst February in terms of value destruction since the Terra-Luna collapse and the cascade of insolvencies that defined 2022.
🌍 Macroeconomic Context: A Hostile Environment
The current correction is not the result of a simple cyclical profit-taking or organic retail-driven fluctuation. It stems from a complex architecture of hostile macroeconomic factors, the massive unwinding of institutional carry trade positions (the « basis trade »), and a market sentiment dominated by « Extreme Fear » psychology. The Crypto Fear & Greed Index recently bottomed at a historic low of 5 out of 100 before recovering marginally to 12 — maintaining the market in a state of paralyzing anxiety.
Tariff Chaos and Risk Aversion
Global risk sentiment has been severely disrupted by what analysts describe as « tariff chaos » induced by the Trump administration. The abrupt announcement of 15% global tariffs sent shockwaves across international markets, reviving fears of imported inflation and strengthening the US Dollar Index (DXY). Far from acting as a safe haven, Bitcoin responded as a high-beta asset, suffering losses proportionally greater than equity indices during liquidation phases. AI sector liquidations have triggered risk-off sector rotation, leaving Bitcoin without its usual institutional buyers.
The Federal Reserve and the Liquidity Illusion
Fed monetary policy remains the undisputed conductor of global liquidity. The Non-Farm Payroll (NFP) report revealed a creation of 130,000 jobs, but was immediately overshadowed by a colossal downward revision of -856,000 jobs for 2025, accompanied by an unemployment rate rise to 4.3%. Despite an emergency injection of $14.6 billion via repo operations in February 2026, markets are waiting for clear rate cut signals — the prerequisite for triggering a new major bull cycle in Bitcoin.
🏦 Institutional Dynamics: The Basis Trade Collapse
One of the most powerful yet underappreciated catalysts of the current bear leg is the systematic unwinding of hedge fund positions within spot Bitcoin ETFs. During the euphoria of 2024–2025, Bitcoin’s futures curve settled into a strong contango, allowing hedge funds to capture annualized yields of 15%–25% through a delta-neutral strategy: buying spot ETF shares (e.g., BlackRock’s IBIT) while simultaneously shorting equivalent futures contracts on the CME.
By February 2026, this annualized yield had collapsed to approximately 4% — barely above the risk-free rate offered by short-term US Treasuries. The result: a massive, algorithmic, price-agnostic wave of ETF redemptions.
| Institution | Exposure Reduction | Detail |
|---|---|---|
| Brevan Howard | -86% | From 36.7M to 5.5M IBIT shares |
| DE Shaw | Massive | Near-total liquidation |
| Farallon Capital | Massive | Exited top holders list |
| Aggregate Hedge Funds | -28% | From 114M to 82M shares (Q3→Q4 2025) |
In total, over $4.5 billion exited US Bitcoin ETFs over five consecutive weeks, imposing a glass ceiling on any recovery attempt.
🔗 On-Chain Analysis: The Anatomy of Capitulation
On-chain data paints a clinical picture of an advanced capitulation phase orchestrated not by retail panic, but primarily by large wallets — the so-called whales.
- Exchange Whale Ratio at 0.64: 64% of all incoming Bitcoin liquidity on exchanges comes from institutional-sized portfolios — a level unseen since October 2015, signaling strategic distribution rather than retail panic selling.
- February 6th capitulation spike: ~60,000 BTC flooded exchanges in a single day, coinciding perfectly with the price breakdown toward $60,000. The 7-day moving average has since normalized to ~23,000 BTC (-60%), suggesting the most acute phase of panic selling may be behind us.
- Stablecoin liquidity collapse: Net USDT inflows onto exchanges plummeted from $616M (November 2025) to a mere $27M recently, with a net outflow of $469M recorded at end-January 2026. Without this dry powder, the market lacks the buying firepower to counter whale selling pressure.
📊 Multi-Timeframe Technical Analysis
Daily Chart — The Macro Bearish Structure
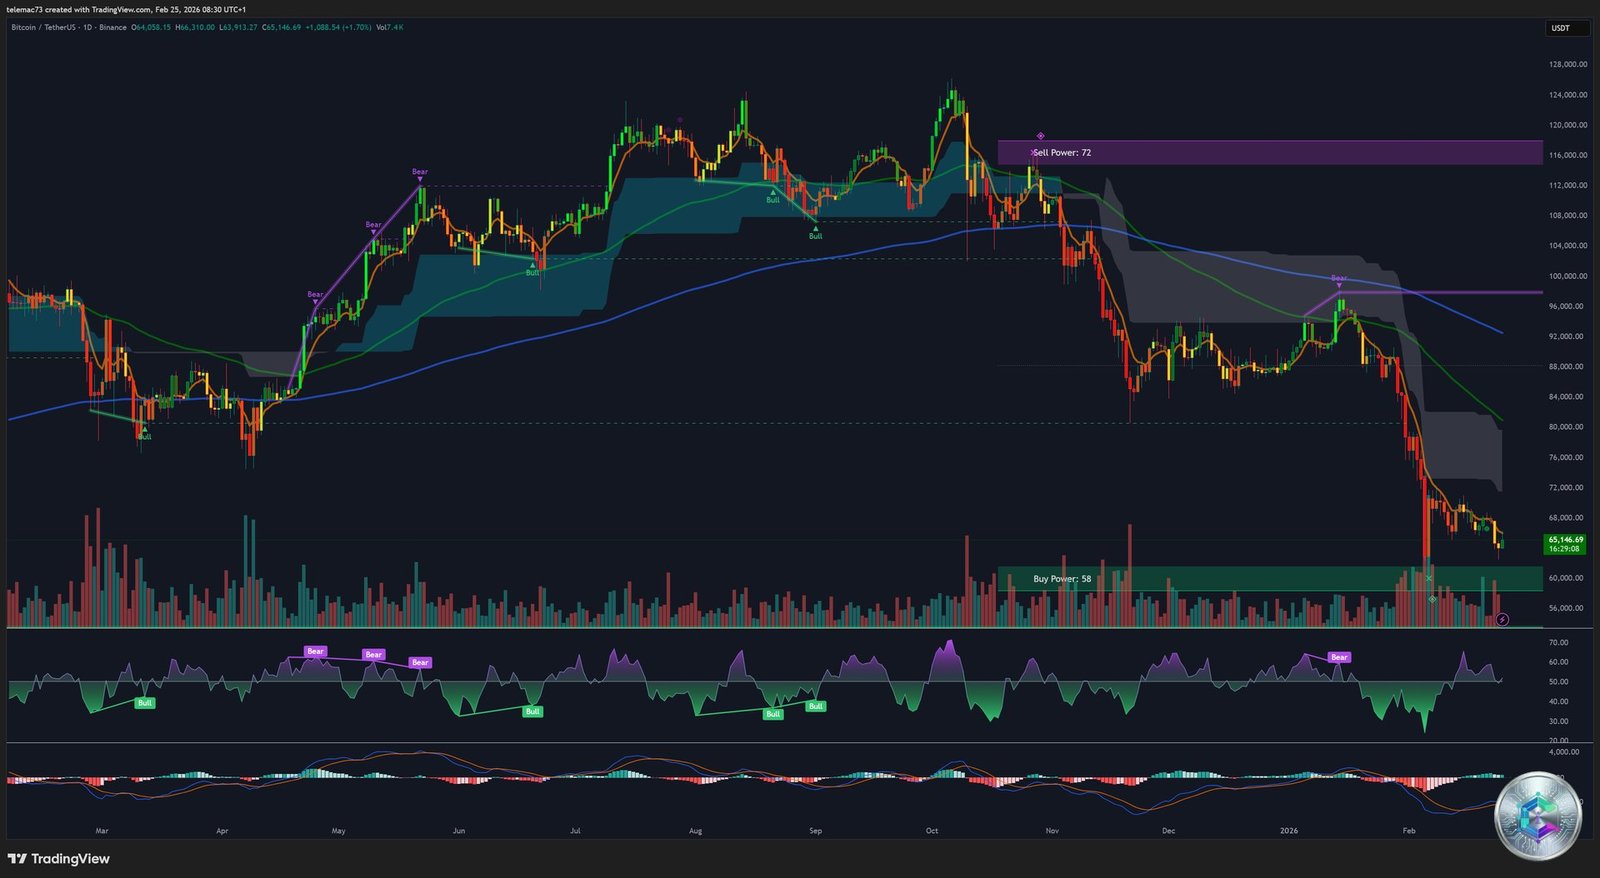
The daily chart confirms an entrenched macro bearish trend. Price navigates deep below the Ichimoku cloud, printing a classic succession of lower highs and lower lows. The market pressure ratio displays an overwhelming Sell Power: 72 vs Buy Power: 58. Momentum oscillators (RSI, MACD) hover in their lower zones with no structural bullish divergence to reverse the macro trend.
4-Hour Chart — The Slow Grind Lower
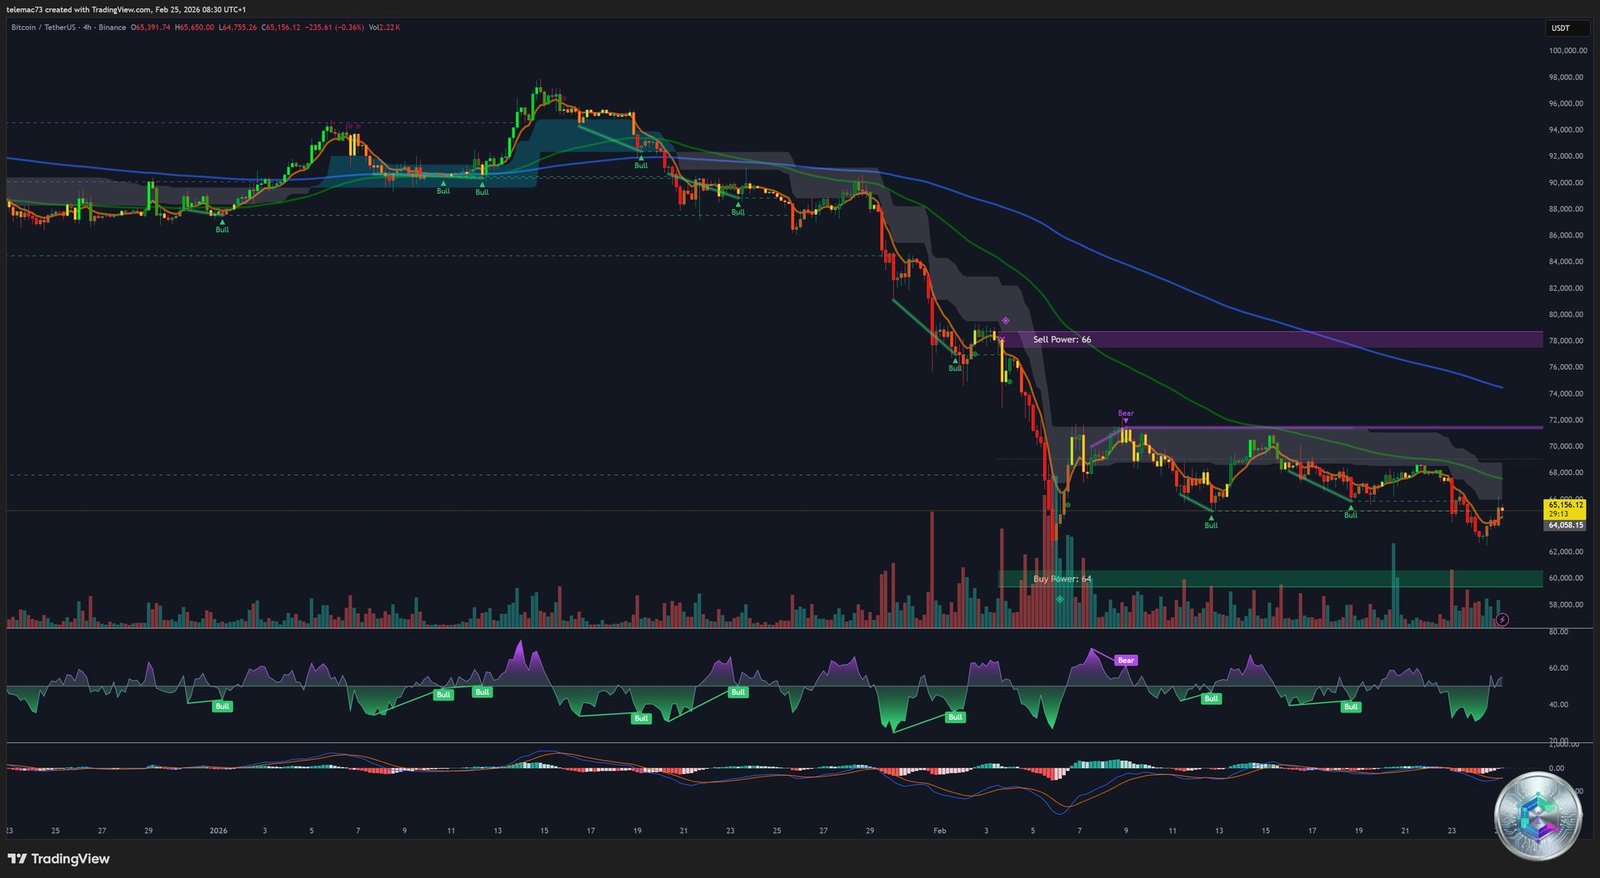
The 4-hour structure reveals a steep descending channel. Every recovery attempt is crushed by the channel’s upper boundary and the descending dynamic moving average. Massive red volume bars during the breakdown below $70,000 attest to genuine capitulation and leveraged long liquidations. The MACD shows a short-term bullish crossover, suggesting a potential technical bounce toward $70,700 — a target itself anchored within the red liquidity wall.
15-Minute Chart — The Algorithmic Battlefield
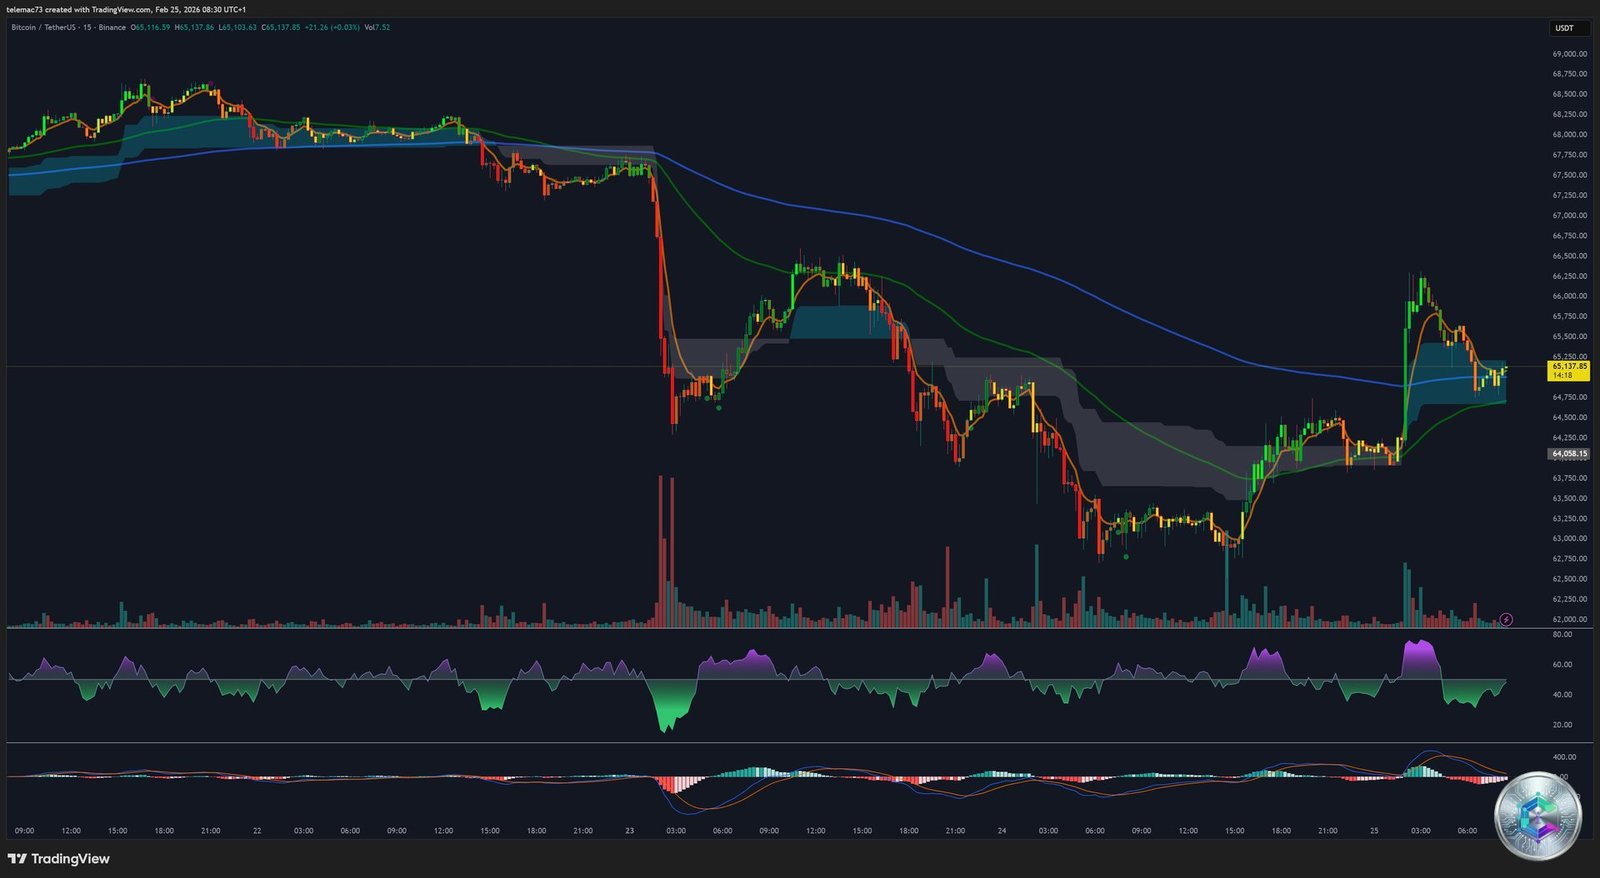
The 15-minute microstructure reveals classic liquidity hunting patterns: violent flash dumps immediately followed by V-shape recoveries — a hallmark of algorithms programmed to trigger retail stop-losses below local supports. The Average True Range (ATR) oscillates between 534 and 568 points, making classical tight stop-loss risk management virtually impossible for retail traders. The Stochastic (9,6) sits at an extreme 97.9–98.4, flagging massive short-term overbought conditions.
Order Book Heatmap — The Invisible Architecture
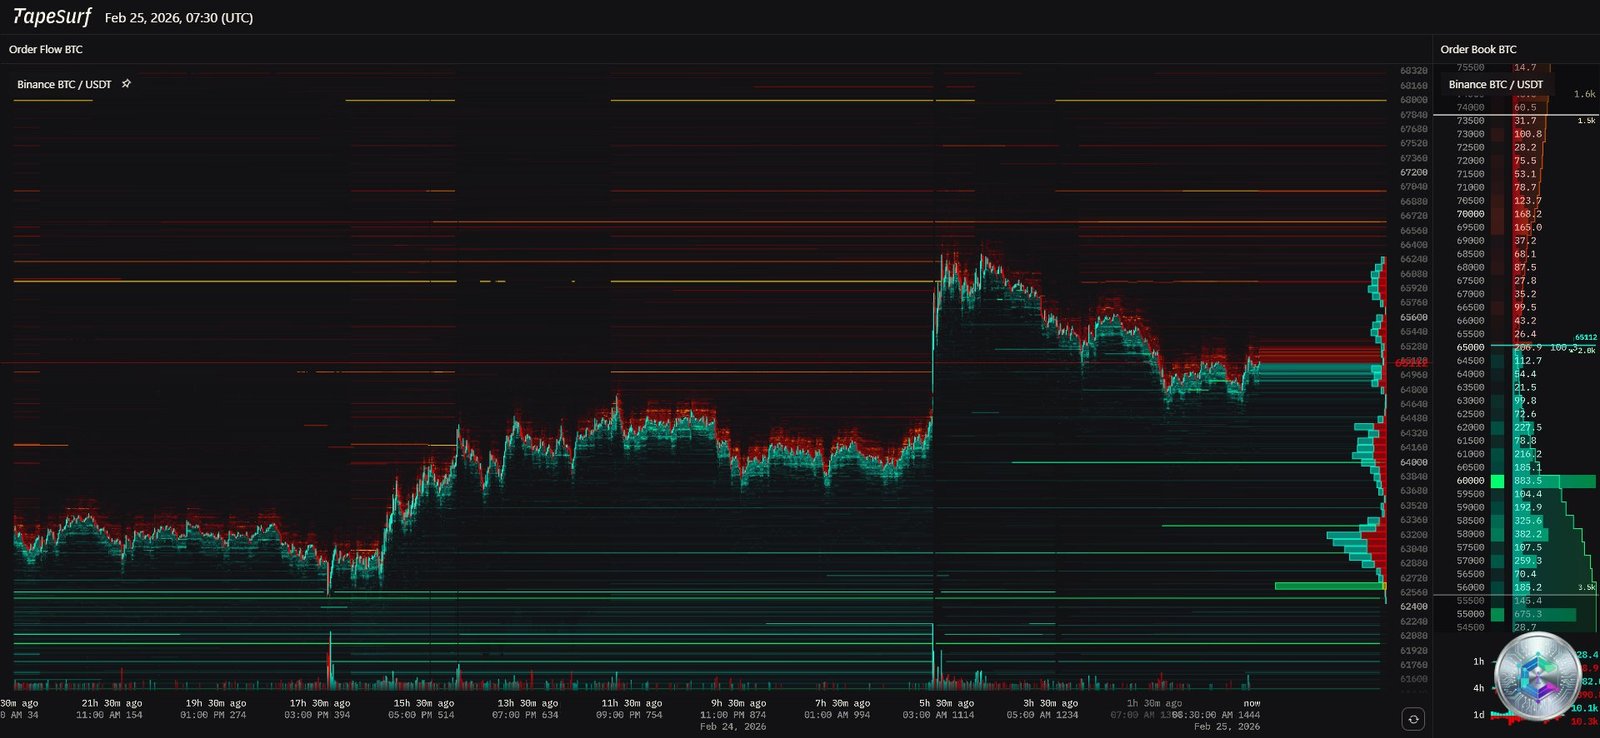
The heatmap reveals two dominant magnetic poles structuring price action:
- 🔴 Institutional Sell Wall ($66,000–$75,000): Extreme density of sell orders — the visual scar of basis trade unwinding and options call hedging. Every recovery attempt hits this iron ceiling and gets absorbed.
- 🟢 Buyer Support Floor ($60,000–$62,000): Massive concentration of buy-side orders — the famous « tripwire » where dip-buying institutions and market makers closing shorts have set their trap. This is the structural safety valve for the market.
🗺️ Key Technical Levels Map
| Level (USD) | Type | Significance |
|---|---|---|
| $124,000–$126,000 | Absolute Resistance | October 2025 ATH — full bear market invalidation |
| $90,000–$95,000 | Macro Pivotal Resistance | Major VPOC — -32% retracement from ATH |
| $80,000–$83,000 | Congestion / SMA 50 | Medium-term sentiment ceiling |
| $70,000–$70,800 | Dense Resistance / SMA 200W | Red heatmap wall + 200-week MA at $70,802 |
| $65,000 | Intraday Pivot | Current oscillation zone dictating momentum |
| $63,000 | Active Consolidation | Precarious equilibrium — ongoing battle zone |
| $60,000–$62,000 | ⚠️ Existential Tripwire | Bull market front line — massive buy orders |
| $59,935 | Last Line of Defense | February’s strict low — stop-loss algorithm trigger |
| $50,000–$52,000 | Trap Door | Abyss target in case of systemic capitulation |
| $47,145 | Final HVN | Volume control point — ultimate absorption zone |
🎯 Probabilistic Scenarios
🔴 Scenario Alpha — The Final Purge (Dominant Probability)
The convergence of data (USDT liquidity collapse, toxic whale ratio of 0.64, ETF exodus) suggests the $60,000 line is structurally vulnerable. A breach below $59,935 would trigger the options dealer hedging mechanism, precipitating a 15–20% flash crash toward $50,000–$55,000. Only after this capital destruction event would the historically negative Sharpe ratio offer a generational entry point for patient long-term capital.
🟢 Scenario Beta — Bullish Rotation (Minority Probability)
If the hedge fund exodus is already fully priced in and exogenous catalysts align (unexpected Fed rate relief, market absorption of Trump tariffs, strong Nvidia earnings), the asset could validate a major double-bottom and trigger a violent short squeeze toward the 200-week SMA at $70,802.
🟡 Scenario Gamma — Atonic Stagnation (Low Probability)
The market gets bogged down in a tight $60,000–$65,000 corridor, dominated by extreme fear (Fear & Greed at 12), until the massive Deribit derivatives expiration. Predatory algorithms exhaust retail traders trapped within this sterile range.
📌 Conclusion
Bitcoin’s near-50% crash from its October 2025 ATH is the direct result of a dislocation in traditional capital markets. The drying up of the asymmetric carry trade yield acted as a black hole, sucking billions of institutional dollars out of spot ETFs. On-chain architecture clinically demonstrates that the market is currently incapable of generating an organic positive demand shock. The $60,000 level remains the ultimate safety valve: its preservation is existential to preventing a deflationary cascade into the technical void around $50,000. The resolution of this asymmetric confrontation will forge the foundation of the next major directional cycle in digital assets.
⚠️ Disclaimer: This article is written for educational and informational purposes only. It does not constitute investment advice, nor a recommendation to buy or sell any digital assets. Cryptocurrency markets are extremely volatile and past performance is not indicative of future results. Only invest what you can afford to lose and consult a licensed financial advisor before making any investment decision.