



As of September 10, 2026, Bitcoin sits at the crossroads of two opposing forces: an orderly technical consolidation following an impressive bullish wave, and a tightening of global macroeconomic conditions that is testing risk appetite. On the eve of the US CPI release and less than a week before the FOMC decision, the market is holding its breath against a backdrop of an overloaded derivatives structure and still-robust institutional inflows.
A Summer Purge, an Explosive August
After bottoming at a cyclical low of $57,735 during the summer, Bitcoin staged a vigorous bullish wave, driving prices to a local peak between $82,283 and $82,300 in early September. That expansion phase has since given way to an orderly bearish drift, pulling the spot price back into an equilibrium zone between $78,175 and $78,356.
This cumulative 54.25% drawdown from the cyclical peak of $126,198 remains notably milder than the drawdowns seen in previous bear markets: 2014-2015 (-81.6%), 2018-2019 (-83.6%), and 2022-2023 (-76.7%) — an observation that fuels the thesis of stronger structural resilience underpinned by spot ETF flows.
The Fed, the CPI, and the Yen Carry Trade Specter
The recent price pullback primarily reflects a reassessment of US rate hike expectations. Stronger-than-expected August jobs data has significantly narrowed the Federal Reserve’s room to maneuver: the CME FedWatch tool and Polymarket prediction markets now price in a 58.4% to 70.5% probability of a 25-basis-point hike at the September 15-16, 2026 FOMC meeting.
The September 11 US CPI release is the immediate decision pivot. Consensus expects headline inflation to stabilize around 3.4%, but Governor Christopher Waller’s cautious remarks suggest the central bank’s final decision will remain heavily conditioned by that number. This uncertainty is compounded by crude oil surging past $92 a barrel, reviving inflation fears, while the Bank of Japan raised its policy rate to 1.0% — its highest level since 1995 — keeping alive the residual risk of a disorderly unwind of yen carry trade positions.
Institutional Flows Remain Solid
Counterbalancing these monetary pressures, institutional demand continues to provide structural support. US spot ETFs recorded net inflows of $986 to $987 million over the past week, extending the momentum from a record August that saw more than $3 billion in net injections. Passive accumulation by corporate treasuries also remains active, exemplified by listed French firm Capital B, which acquired an additional 376 BTC for $29 million.
This picture contrasts, however, with more subdued retail participation: the Coinbase Premium Index and CryptoQuant’s apparent spot demand metric both briefly turned negative. Most of the recent bullish velocity has in fact come from the derivatives segment, where aggregate open interest rose by $2.3 billion (+9.24%) to reach $27.53 billion during the push toward $82,000 — a market structure that, combined with record unrealized profits of $9.07 billion among short-term holders, significantly increases price sensitivity to liquidity swings.
| Market Metric | Reading | Consequence |
|---|---|---|
| Fed rate hike probability (September) | 58.4% – 70.5% | Tightening of global liquidity conditions |
| Major macro catalyst | US CPI (Sept. 11, 2026) | Direct trigger for directional volatility |
| Weekly spot BTC ETF flows | +$987 million | Continued absorption of floating supply |
| Aggregate derivatives open interest | $27.53B (+9.24%) | Heightened vulnerability to liquidation cascades |
| Short-term whale unrealized profit | $9.07B | Risk of tactical profit-taking |
| Fear & Greed Index | 71/100 (Greed) | Vulnerable to corrective consolidations |
| Crude oil (WTI/Brent) | > $92/barrel | Persistent inflationary pressure |
Multi-Timeframe Technical Analysis
Daily Timeframe (1D): The Makings of a Golden Cross
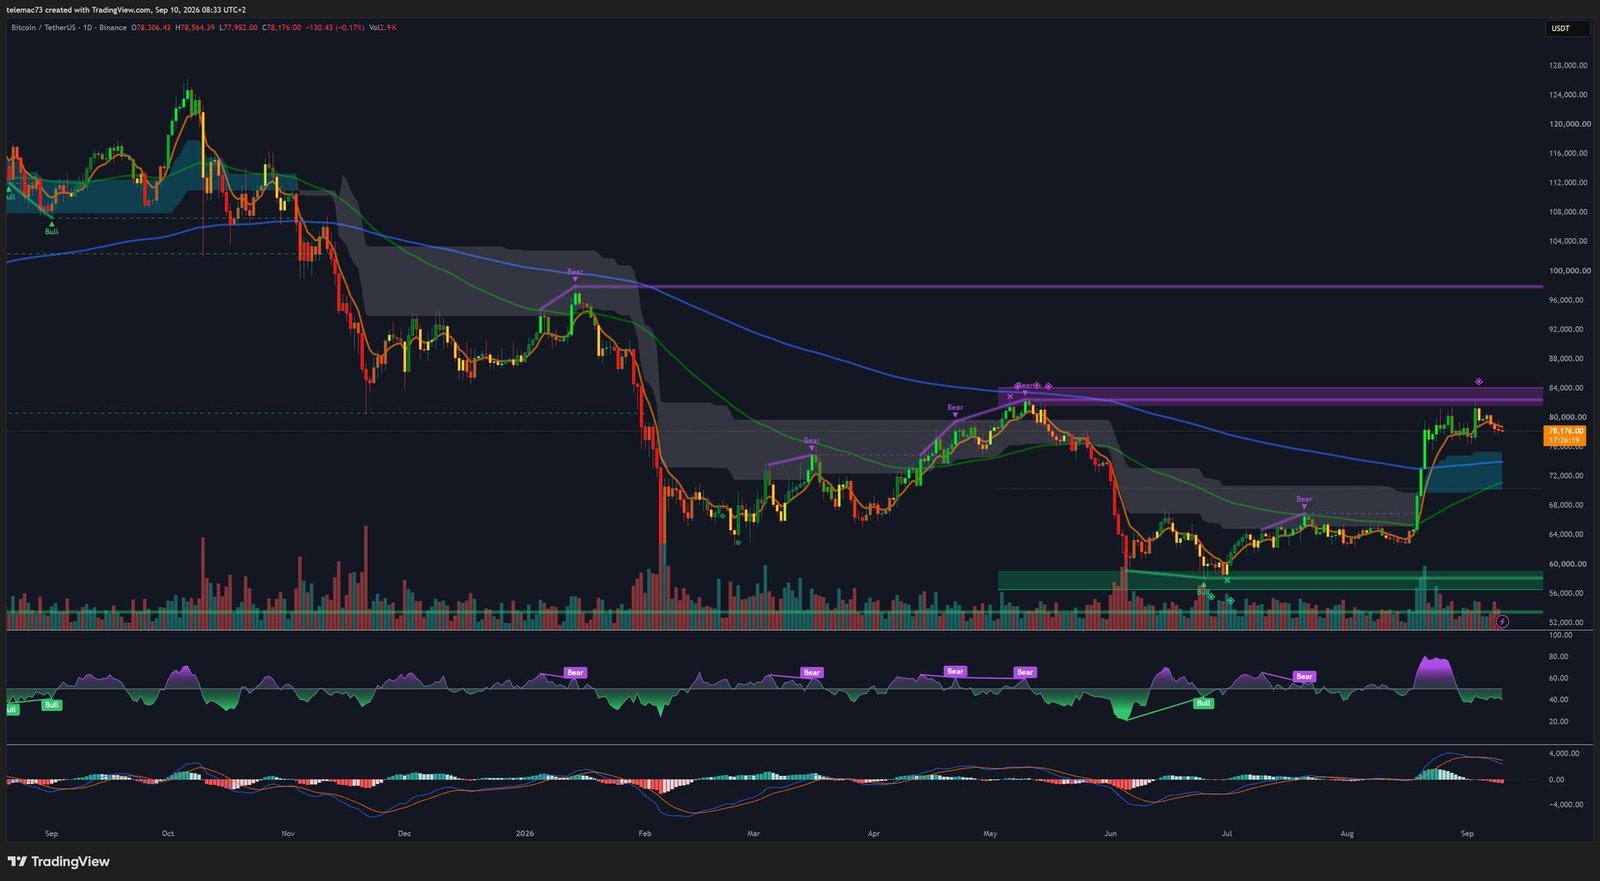
On the daily horizon, Bitcoin confirms a major transition between bearish deleveraging and the start of an institutional bull market. August’s powerful rally pulled price out of its $58,000-$64,000 accumulation range, pushing it above both the 50-day and 200-day exponential moving averages — setting up the makings of a Golden Cross, traditionally a harbinger of a long-term bullish reorientation. The expansion, however, ran into the structural resistance zone at $82,000-$83,300.
The daily RSI (14-period) recorded a pronounced overbought reading above 73 points as price tested $82,283, before recalibrating toward 58 points — a healthy technical breather that does not undermine the sequence of higher lows. The MACD shows a continued bullish separation from its signal line since mid-August, with no bearish Death Cross forming on this timeframe, giving the current pullback the status of an impulse consolidation rather than a trend reversal.
Intermediate Timeframe (4H): A Bull Flag Taking Shape
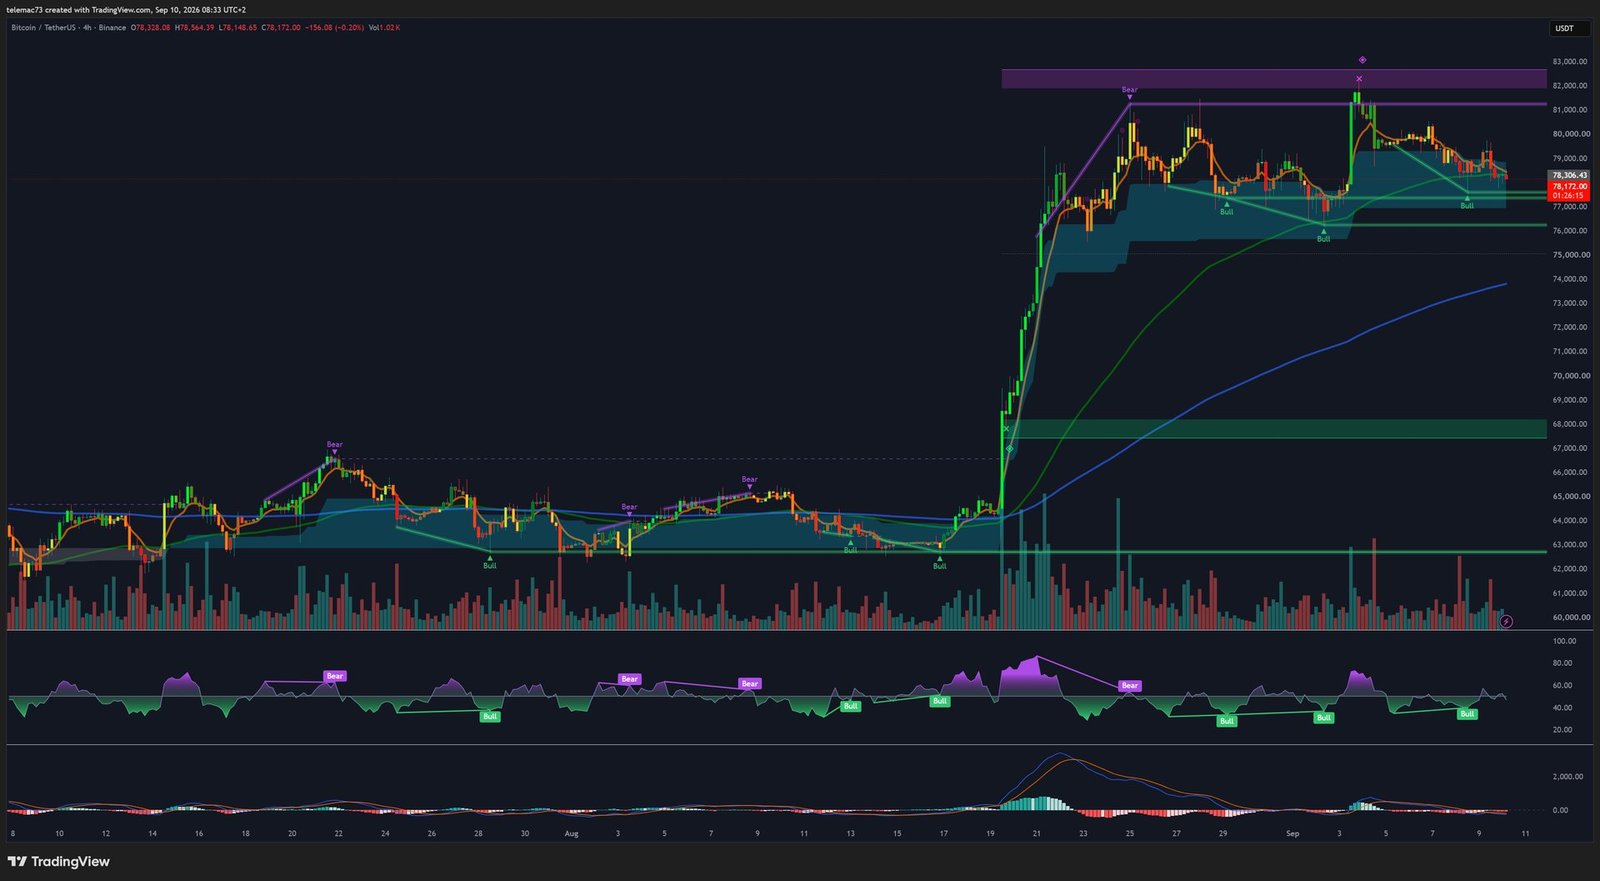
The 4-hour timeframe offers a detailed view of the local exhaustion structure that followed the vertical advance from $64,000. Repeated failures to clear the $82,300 zone have formed a local double top, capped by the institutional liquidity band between $81,800 and $83,300. This double rejection has produced a descending consolidation wedge, technically comparable to a Bull Flag whose flagpole corresponds to the impulsive move of the second half of August.
The 4H RSI, after topping above 75 points, has pulled back to 44 points without entering extreme oversold territory — an orderly deleveraging purge. The 4H MACD registered a bearish Death Cross at the peak, pushing its histogram into negative territory; however, the recent flattening of the histogram bars points to gradually fading selling momentum. Fibonacci retracement levels place the 38.2% threshold at $77,850 — scrupulously defended on 4H candle closes — while the 50% median retracement converges near $76,400 and the golden 61.8% level sits around $74,500.
Intraday Timeframe (15m): Compression and an Attempted Breakout
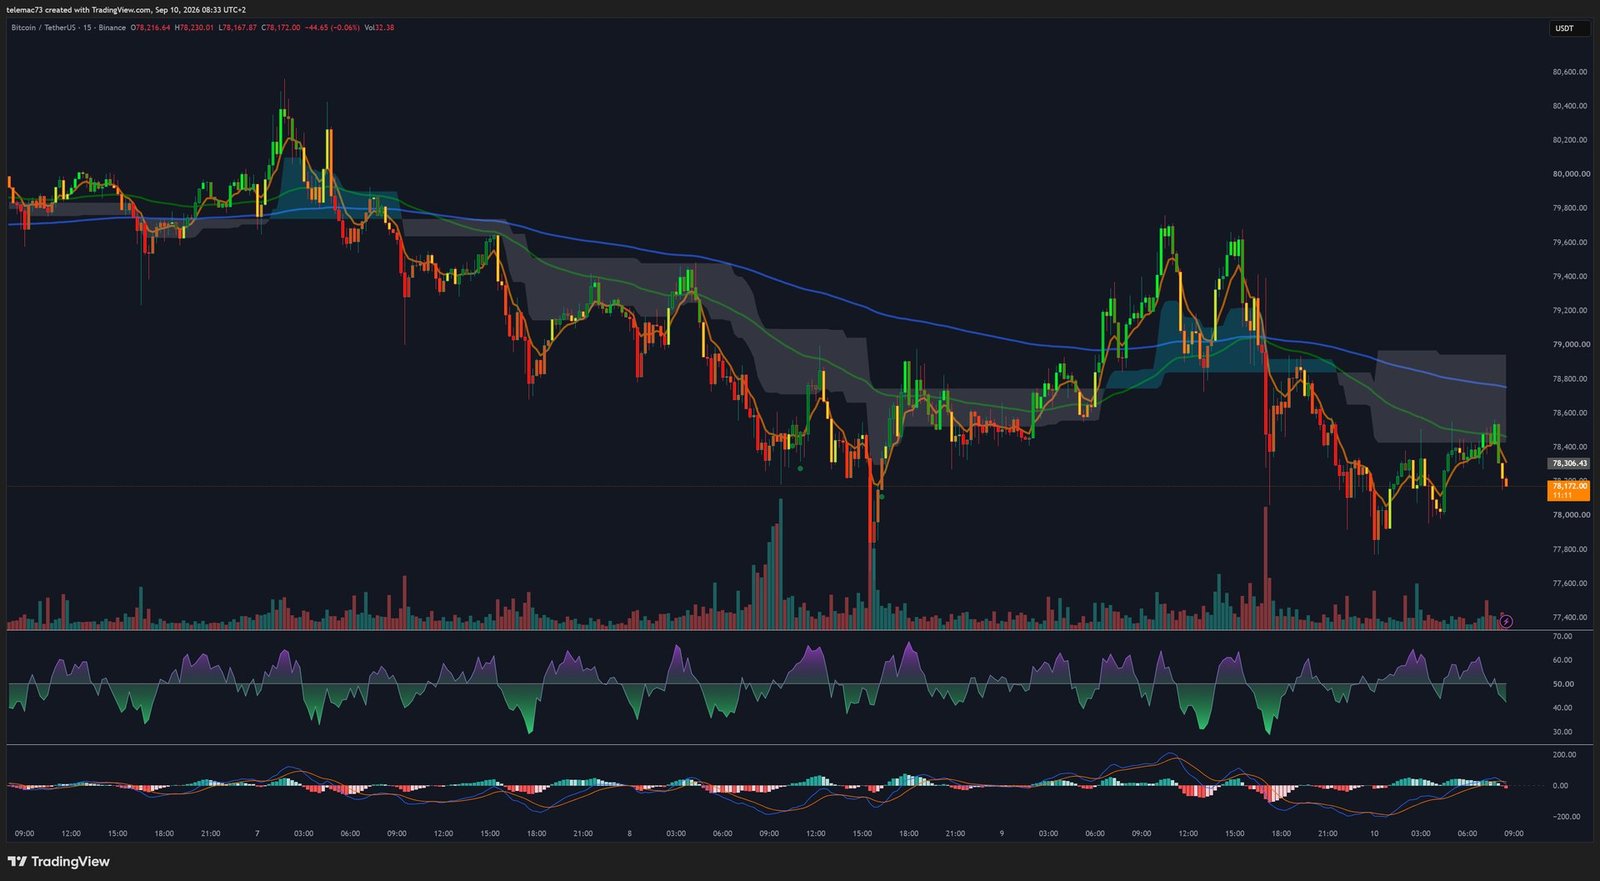
On the 15-minute chart, price action is confined within a steady descending channel initiated after the rejection below $80,400, punctuated by several liquidity sweeps under $78,000 — each generating long rejection wicks around $77,600-$77,800, revealing passive algorithmic buyers absorbing the sell-offs. Price is currently testing the upper boundary of this channel, between $78,175 and $78,356.
The 15m RSI, after dipping below 28 points and marking pronounced oversold conditions, has begun a bullish divergence, pulling the oscillator back toward its neutral 50-point line. The 15m MACD confirmed an intraday golden cross (“micro Golden Cross”) below the equilibrium line, supported by the histogram moving into positive territory, suggesting an attempted directional push toward the intraday pivot at $78,850.
| Timeframe | Trend | RSI (14) | MACD Status | Key Setup |
|---|---|---|---|---|
| Daily (1D) | Bullish (structural) | ~58 (normalized after >73) | Fast line > signal | Golden Cross setup / accumulation breakout |
| 4-Hour (4H) | Corrective / neutral | ~44 (low-neutral zone) | Death Cross, flattening histogram | Bull flag / double-top rejection |
| 15-Minute (15m) | Descending compression | ~50 (rebound from <28) | Micro Golden Cross below zero | Descending channel / breakout attempt |
Liquidity Mapping: Where the Battle Is Being Fought
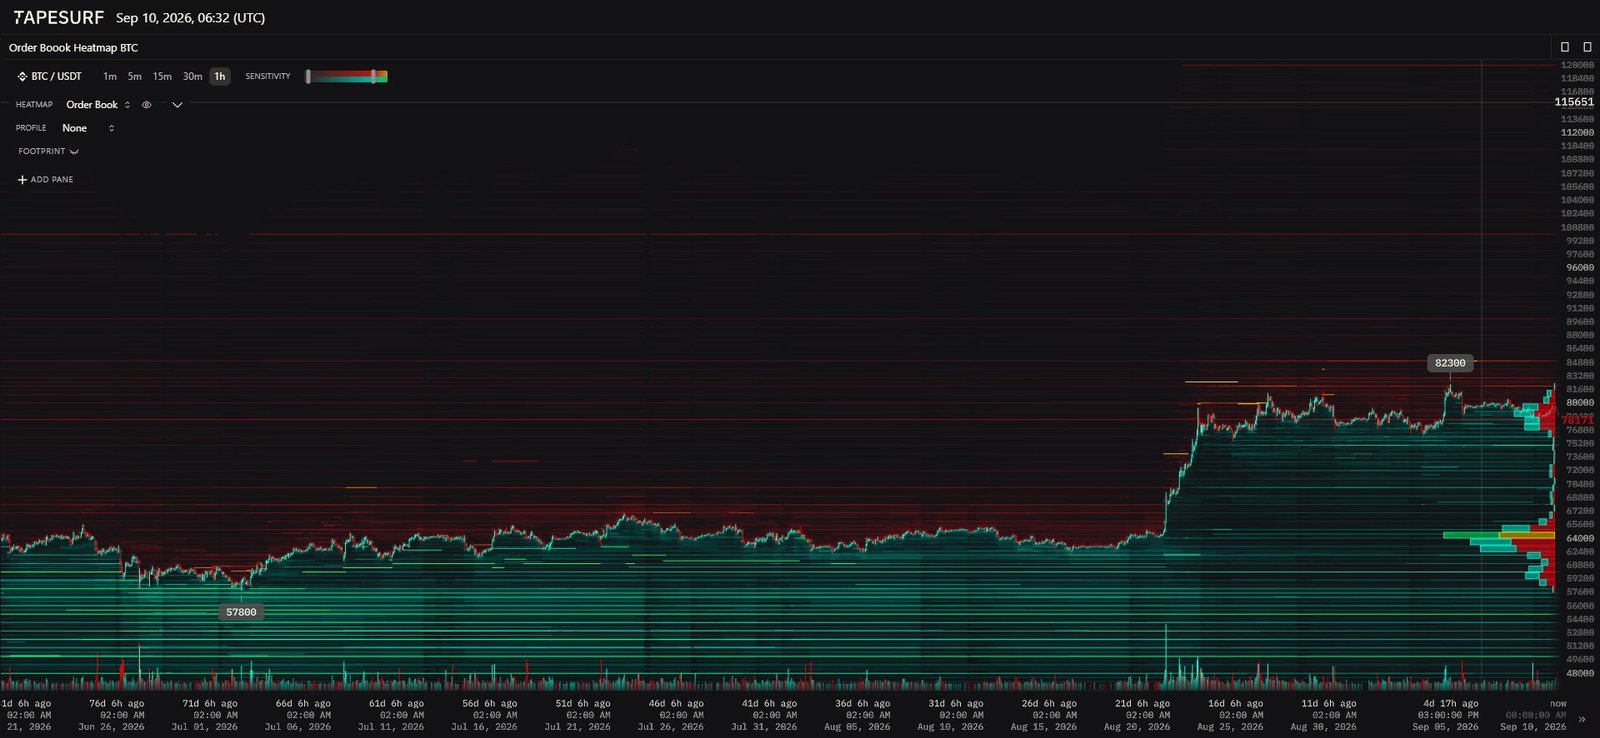
Examination of the BTC/USDT order book liquidity heatmap reveals a pronounced asymmetry between upper sell walls and the absorption pools beneath the market. A heavy concentration of sell-side limit orders runs continuously between $80,000 and $83,000, with an initial algorithmic wall at $80,560. Beyond that, a pocket of major institutional orders girds the $82,300 swing high, topped by an even larger liquidity field between $83,000 and $86,000 — a zone where short-position invalidation levels and futures liquidation prices accumulate, making it a prime target for a short squeeze should a positive catalyst emerge.
Beneath current prices, order book depth shows a dense network of buy limit orders between $77,000 and $78,000, methodically absorbing sell pressure. Lower down, a massive institutional buy wall sits between $74,500 and $75,000 — corresponding to the old pre-breakout consolidation base and the 4H 200-EMA — ahead of the ultimate reference point at the summer cyclical low of $57,800. Volume Profile analysis confirms a High Volume Node between $78,100 and $78,600, acting as a center of gravity where sell orders are absorbed by institutional market makers.
Key Technical Levels: The Threshold Matrix
- R3: $83,300 — upper invalidation zone for short positions and mass liquidations
- R2: $82,300 — swing high / 4H chart double top
- R1: $80,560 — sell-order wall / $80k psychological threshold
- P: $78,850 — central pivot, intraday flow inflection point
- S1: $77,800 – $78,000 — immediate support / 15m decompression low
- S2: $77,000 – $77,200 — structural floor of the 4H bull flag
- S3: $74,500 – $75,000 — deep institutional support / 4H 200-EMA alignment
Three Scenarios for the Coming Days
Primary Scenario — Bullish Breakout from the Flag (Probability: 55%)
The current contraction resolves in continuation of August’s uptrend. Absorption confirmed by the heatmap between $77,800 and $78,350 lays the groundwork for fading sell pressure. Activation requires clearing the intraday pivot at $78,850, confirmed by a 4H close above $79,000, opening the path to $80,560 and then $82,300, with potential extension toward the $83,300-$86,000 band. Invalidation level: a daily close below $77,000.
Secondary Scenario — Sideways Compression Ahead of the FOMC (Probability: 30%)
The market remains directionally listless until the September 16 FOMC conclusions, trading within a channel bounded by $77,800 support and $80,200-$80,560 resistance. This sequence would feature contracting implied volatility and mean-reversion strategies around identified order-book walls.
Alternative Scenario — Bearish Breakdown and Derivatives Flush (Probability: 15%)
A hotter-than-expected CPI print, fueled by energy prices, would force the market to fully price in a durably restrictive monetary policy. A confirmed break of the $77,000 pivot support would validate a downside break of the bull flag, triggering a cascade of forced liquidations toward $74,500-$75,000, potentially extending to $72,000. This scenario would lose relevance on a swift bullish reintegration above $78,500 following a dip below $77,000 — a sign of a simple stop-loss hunt (bear trap).
Strategic Summary and Risk Management
The combination of multi-timeframe chart structures and order-book liquidity distribution indicates that Bitcoin’s structural uptrend remains intact, though temporarily capped beneath the $82,300-$83,300 barrier. The current corrective phase resembles a healthy decompression of daily momentum indicators, with the RSI having exited its critical overbought zone to realign with underlying trend dynamics.
Operational risk management nonetheless demands extreme discipline given the notable rise in derivatives open interest, now exceeding $27.5 billion. This concentration of leveraged exposure creates fertile ground for violent liquidity sweeps on either side of the immediate technical boundaries at $77,800 and $80,560. Ahead of the US CPI print and the Fed’s policy deliberations, holding above the technical base of $77,000-$77,200 remains the key condition for preserving the integrity of the bullish structure.
Disclaimer: This article is provided strictly for educational and informational purposes. It does not constitute investment advice, a recommendation to buy or sell, or an inducement to make any financial decision. Cryptocurrency markets are highly volatile and carry substantial risk of capital loss. Do your own research (DYOR) and consult a licensed financial advisor before making any investment decision.

